addoobot vs Vizly
In the contest of addoobot vs Vizly, which AI Data Science tool is the champion? We evaluate pricing, alternatives, upvotes, features, reviews, and more.
If you had to choose between addoobot and Vizly, which one would you go for?
When we examine addoobot and Vizly, both of which are AI-enabled data science tools, what unique characteristics do we discover? The community has spoken, addoobot leads with more upvotes. addoobot has 7 upvotes, and Vizly has 6 upvotes.
Does the result make you go "hmm"? Cast your vote and turn that frown upside down!
addoobot

What is addoobot?
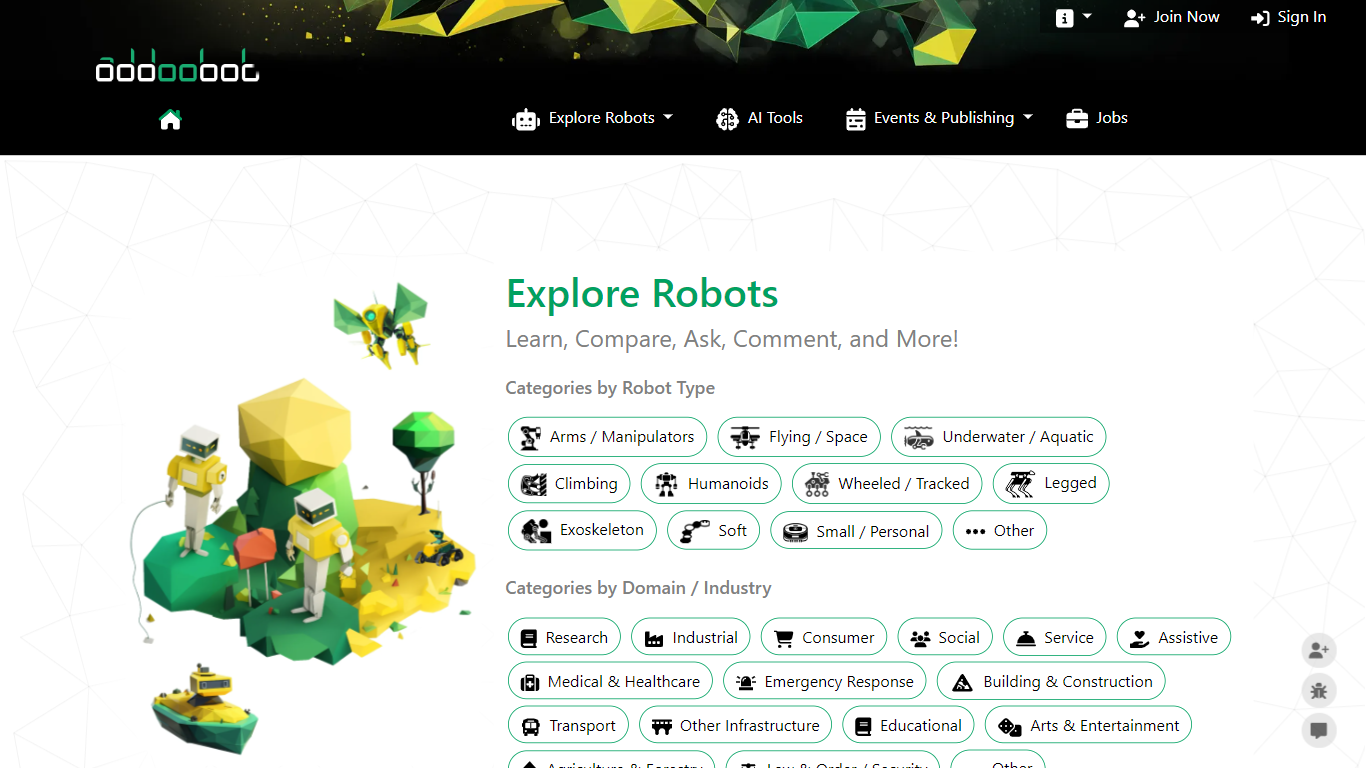
addoobot provides detailed information and tools to explore and evaluate a wide variety of robots. It organizes robots by type and industry, offering specifications, videos, and comparisons to help users understand different robotic systems.
What sets addoobot apart is its expert-led consultancy services and its focus on structured, accessible content. Unlike general robotics databases, addoobot combines comprehensive data with practical guidance from experienced professionals.
The platform serves diverse users including engineers, researchers, businesses, and enthusiasts. It continuously updates its database and plans to expand community-driven content to enrich the robotics ecosystem.
Based in Sydney, Australia, addoobot is led by Dr. Mahdi Hassan, a robotics PhD with extensive industry experience. The platform aims to simplify the complex robotics landscape and support informed decision-making.
Vizly
What is Vizly?
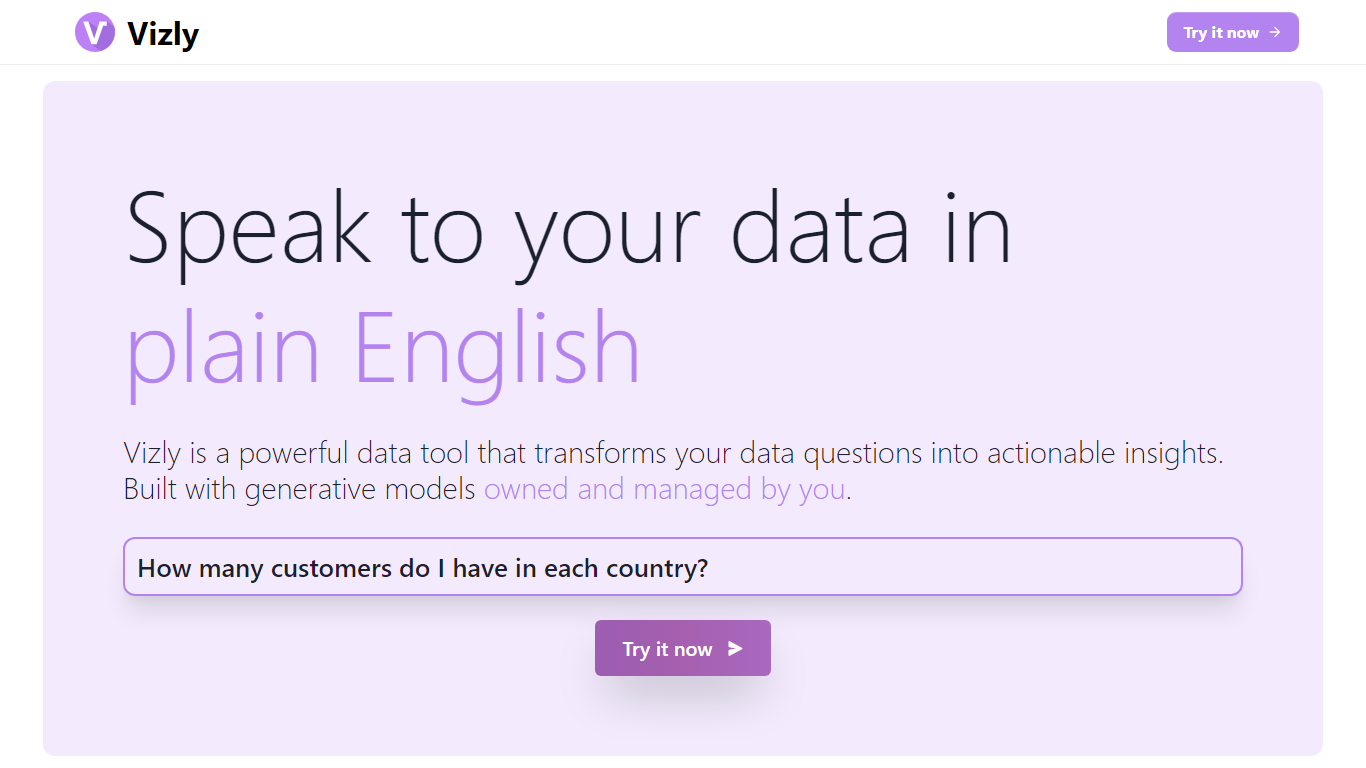
Vizly turns spreadsheet uploads into charts and statistical answers through a chat interface. Upload Excel, CSV, or SPSS files, ask questions in plain language, and get interactive Plotly visualizations, regression lines, and correlation matrices back. A private Python sandbox handles machine learning when you need more than summary stats.
Where Tableau and Looker focus on dashboards you configure by hand, Vizly leans on conversational analysis. You describe what you want to know and the app generates visuals on the fly. The trade-off is less pixel-perfect dashboard control in exchange for faster exploratory analysis.
Vizly suits students, analysts, and researchers in healthcare, finance, and genetics who need quick charts without writing notebook code. Premium adds unlimited messages, persistent files between sessions, and high-performance coding environments for heavier workloads.
addoobot Upvotes
Vizly Upvotes
addoobot Top Features
Explore robots by detailed categories and industries for targeted discovery
Compare robots side-by-side with structured specifications and videos
Access rich video content showcasing robot capabilities and applications
Benefit from expert consultancy services for robotics project guidance
Subscribe to newsletters featuring the latest robotics news and innovations
Vizly Top Features
Chat interface generates Plotly visualizations and statistical analysis from uploaded files
Supports Excel, CSV, and SPSS with built-in data cleaning tools
Private Python code sandbox for machine learning and predictive modeling
Premium plan offers unlimited messages and persistent files between sessions
Use-case templates for healthcare, finance, and genetic research workflows
addoobot Category
- Data Science
Vizly Category
- Data Science
addoobot Pricing Type
- Freemium
Vizly Pricing Type
- Freemium