Faraday vs Vizly
In the face-off between Faraday vs Vizly, which AI Data Science tool takes the crown? We scrutinize features, alternatives, upvotes, reviews, pricing, and more.
When we put Faraday and Vizly head to head, which one emerges as the victor?
If we were to analyze Faraday and Vizly, both of which are AI-powered data science tools, what would we find? The upvote count is neck and neck for both Faraday and Vizly. The power is in your hands! Cast your vote and have a say in deciding the winner.
Does the result make you go "hmm"? Cast your vote and turn that frown upside down!
Faraday

What is Faraday?
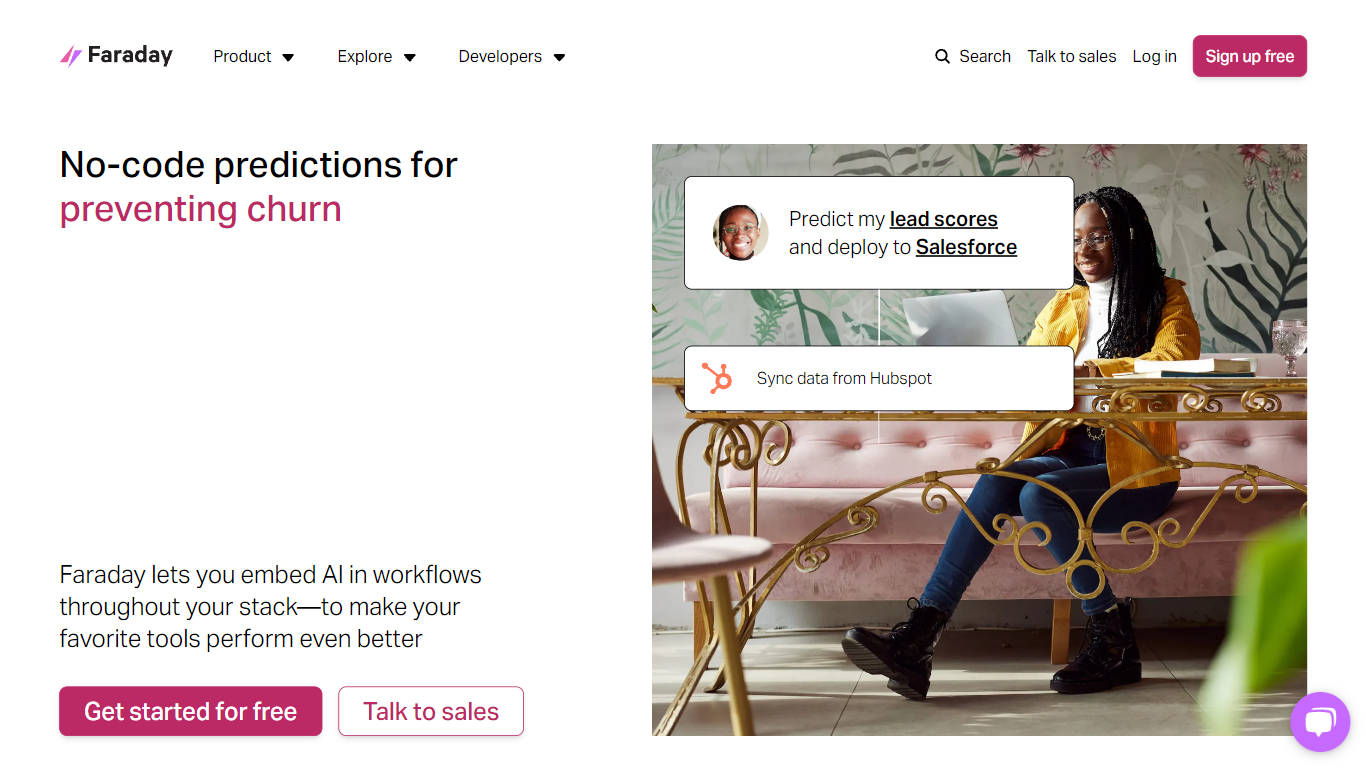
Faraday delivers customer context on roughly 240 million U.S. adults through its Faraday Identity Graph, giving marketing teams and AI agents the demographic, financial, and lifestyle signals that first-party CRM data alone cannot provide. Founded in 2012 and based in Burlington, Vermont, the platform enriches lead lists, builds propensity and churn models, and deploys predictions via REST API, MCP server, or batch files into warehouses like Snowflake, BigQuery, and Redshift.
Where traditional lead scoring tools rely on clicks and form fills, Faraday layers real-world household context onto your own customer records before training bespoke machine learning models. Case studies cite a jewelry brand personalizing at scale, American Standard closing leads at 3x higher margin, and Bespoke Post seeing 5x ROI on subscription box targeting. Both Faraday Pro (self-serve, pay per match) and Faraday Enterprise (custom models, sales-led setup) draw from the same identity graph.
E-commerce brands, financial services firms, home services companies, and AI platform builders use Faraday to segment personas, score propensity to buy, and ground agent workflows in verified consumer data rather than guesswork.
Vizly
What is Vizly?
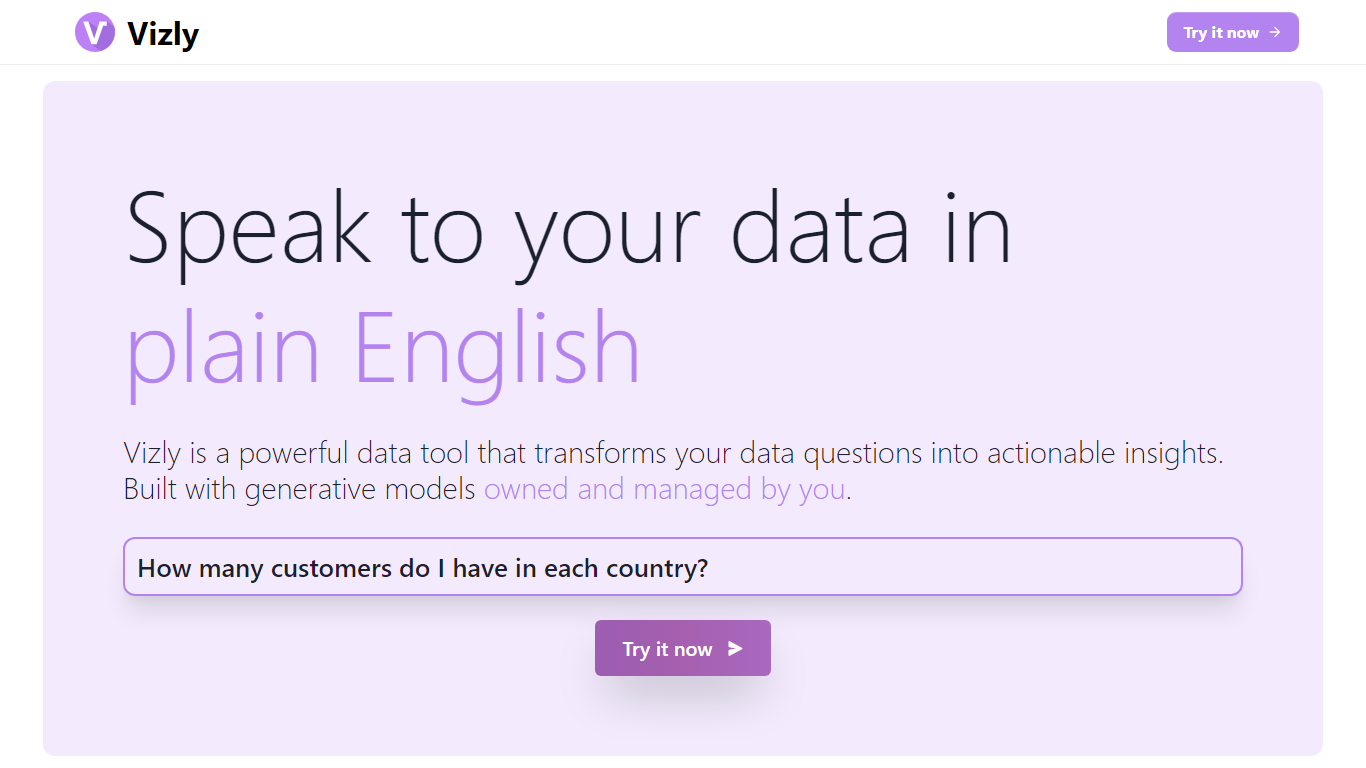
Vizly turns spreadsheet uploads into charts and statistical answers through a chat interface. Upload Excel, CSV, or SPSS files, ask questions in plain language, and get interactive Plotly visualizations, regression lines, and correlation matrices back. A private Python sandbox handles machine learning when you need more than summary stats.
Where Tableau and Looker focus on dashboards you configure by hand, Vizly leans on conversational analysis. You describe what you want to know and the app generates visuals on the fly. The trade-off is less pixel-perfect dashboard control in exchange for faster exploratory analysis.
Vizly suits students, analysts, and researchers in healthcare, finance, and genetics who need quick charts without writing notebook code. Premium adds unlimited messages, persistent files between sessions, and high-performance coding environments for heavier workloads.
Faraday Upvotes
Vizly Upvotes
Faraday Top Features
Faraday Identity Graph covers approximately 240 million U.S. adults with 1,500+ attributes per person
REST API returns enriched identity and predictive scores in under 200 milliseconds
Native MCP server lets AI agents pull customer context directly into their workflow
Propensity and recommender model builders train custom predictions on your first-party data
Integrates with Snowflake, BigQuery, Redshift, Salesforce, Shopify, and 50+ downstream tools
SOC 2 Type II certified since 2020 with HIPAA, GDPR, and CCPA compliance
Vizly Top Features
Chat interface generates Plotly visualizations and statistical analysis from uploaded files
Supports Excel, CSV, and SPSS with built-in data cleaning tools
Private Python code sandbox for machine learning and predictive modeling
Premium plan offers unlimited messages and persistent files between sessions
Use-case templates for healthcare, finance, and genetic research workflows
Faraday Category
- Data Science
Vizly Category
- Data Science
Faraday Pricing Type
- Freemium
Vizly Pricing Type
- Freemium