GreenEyes.AI vs Vizly
In the face-off between GreenEyes.AI vs Vizly, which AI Data Science tool takes the crown? We scrutinize features, alternatives, upvotes, reviews, pricing, and more.
When we put GreenEyes.AI and Vizly head to head, which one emerges as the victor?
If we were to analyze GreenEyes.AI and Vizly, both of which are AI-powered data science tools, what would we find? The upvote count is neck and neck for both GreenEyes.AI and Vizly. The power is in your hands! Cast your vote and have a say in deciding the winner.
Feeling rebellious? Cast your vote and shake things up!
GreenEyes.AI

What is GreenEyes.AI?
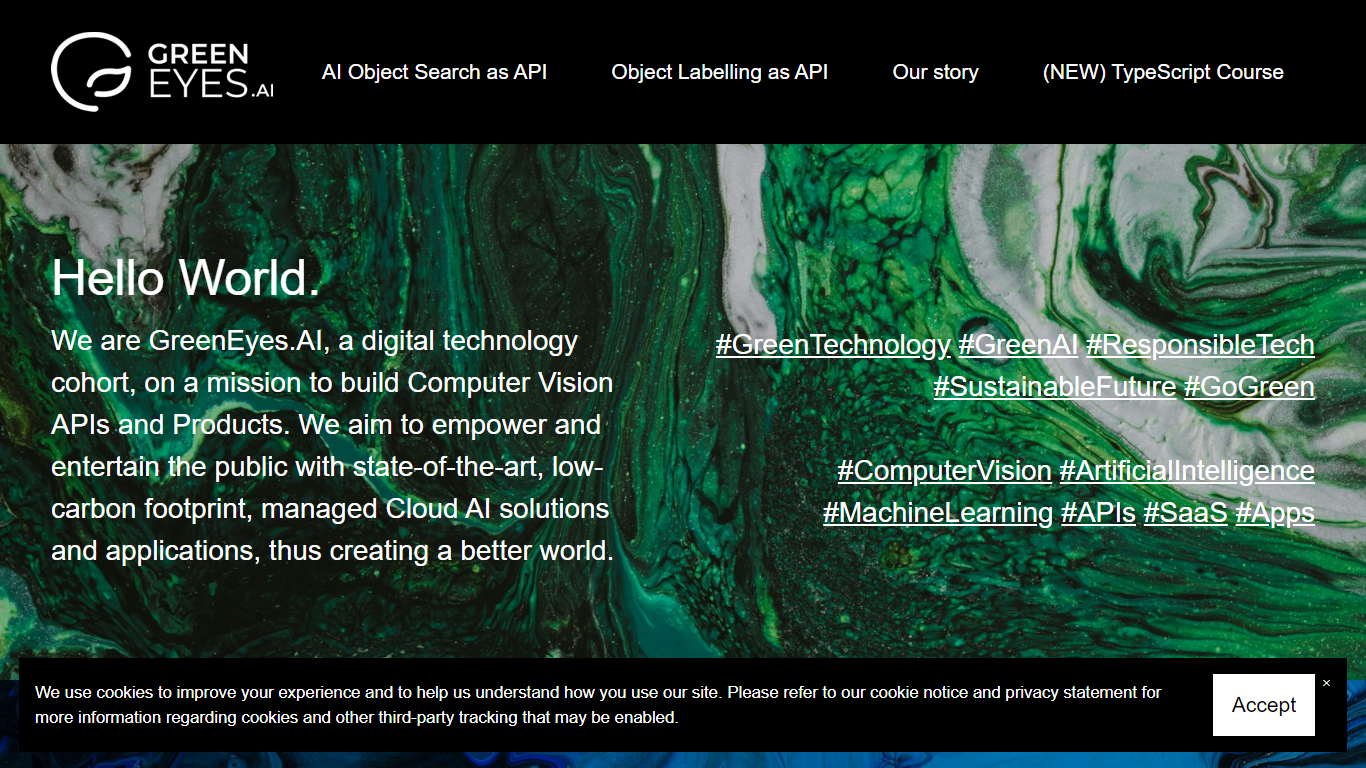
GreenEyes.AI builds managed cloud computer vision APIs with a focus on low-carbon infrastructure. The company offers plug-and-play REST endpoints for visual search, object labeling, content-based image retrieval, image shielding, and a generative chatbot that lets users query uploaded photos in natural language.
Founded in mid-2022 by digital veterans, GreenEyes.AI positions itself around responsible tech and sustainable AI. Its platform targets enterprise workloads with a 99.9% uptime SLA, object storage tied to organization accounts, and a web console for managing applications and datasets.
Developers integrate through the GreenEyesAI Web Console, which issues application credentials for authentication against api.cloud.greeneyesai.com. The service is currently in private alpha, with a TypeScript toolkit on NPM and a browser JavaScript plugin for client-side recognition calls.
Vizly
What is Vizly?
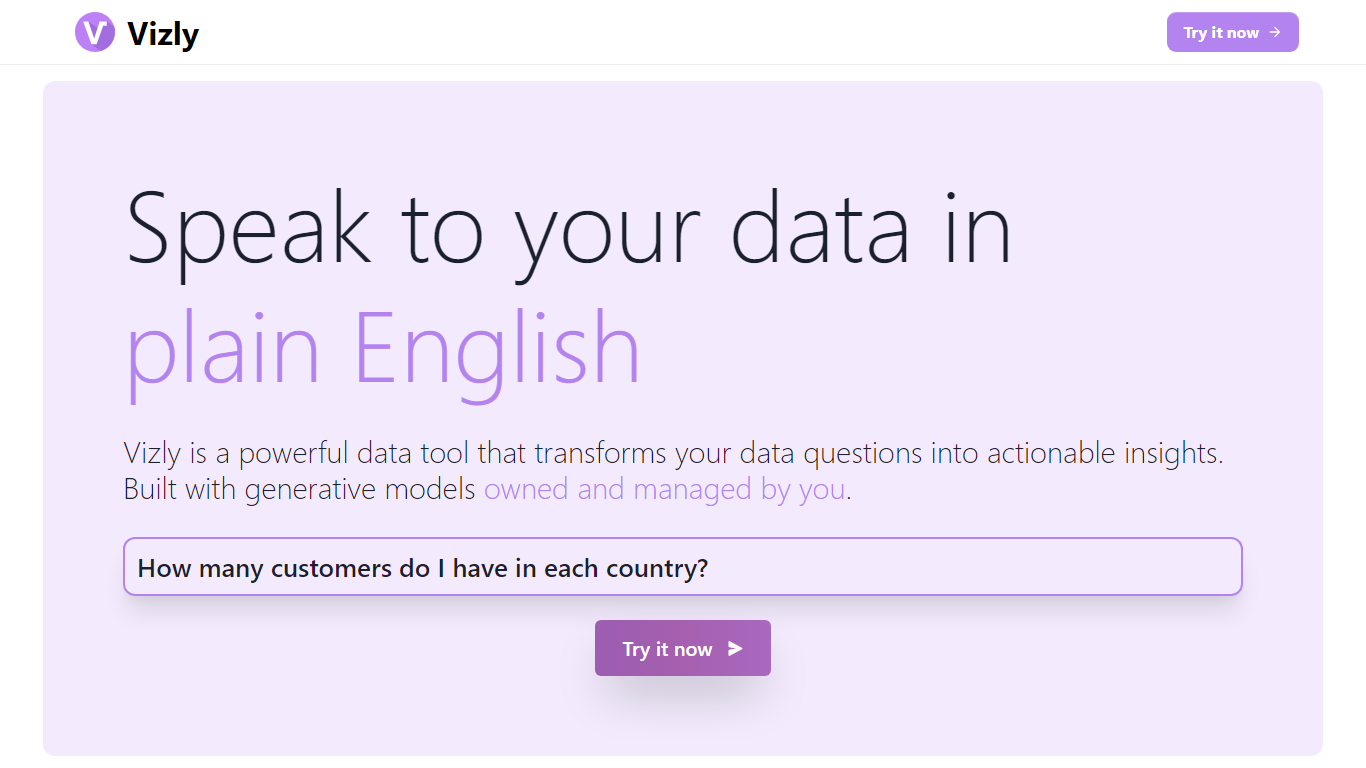
Vizly turns spreadsheet uploads into charts and statistical answers through a chat interface. Upload Excel, CSV, or SPSS files, ask questions in plain language, and get interactive Plotly visualizations, regression lines, and correlation matrices back. A private Python sandbox handles machine learning when you need more than summary stats.
Where Tableau and Looker focus on dashboards you configure by hand, Vizly leans on conversational analysis. You describe what you want to know and the app generates visuals on the fly. The trade-off is less pixel-perfect dashboard control in exchange for faster exploratory analysis.
Vizly suits students, analysts, and researchers in healthcare, finance, and genetics who need quick charts without writing notebook code. Premium adds unlimited messages, persistent files between sessions, and high-performance coding environments for heavier workloads.
GreenEyes.AI Upvotes
Vizly Upvotes
GreenEyes.AI Top Features
Photo-to-object visual search REST API built for marketplaces and large image archives
Object labeling across 80+ standard classes for auto-tagging and moderation
Data Explorer app for content-based image retrieval without writing code
Image Shielding adds invisible PGD noise to block unauthorized AI scraper training
Generative chatbot lets shoppers upload photos and search inventory by description
Object Semantic Search alpha finds images by conceptual similarity, not pixel matching
Vizly Top Features
Chat interface generates Plotly visualizations and statistical analysis from uploaded files
Supports Excel, CSV, and SPSS with built-in data cleaning tools
Private Python code sandbox for machine learning and predictive modeling
Premium plan offers unlimited messages and persistent files between sessions
Use-case templates for healthcare, finance, and genetic research workflows
GreenEyes.AI Category
- Data Science
Vizly Category
- Data Science
GreenEyes.AI Pricing Type
- Paid
Vizly Pricing Type
- Freemium