Kyligence vs Vizly
Explore the showdown between Kyligence vs Vizly and find out which AI Data Science tool wins. We analyze upvotes, features, reviews, pricing, alternatives, and more.
When comparing Kyligence and Vizly, which one rises above the other?
When we contrast Kyligence with Vizly, both of which are exceptional AI-operated data science tools, and place them side by side, we can spot several crucial similarities and divergences. Both tools are equally favored, as indicated by the identical upvote count. Your vote matters! Help us decide the winner among aitools.fyi users by casting your vote.
Feeling rebellious? Cast your vote and shake things up!
Kyligence
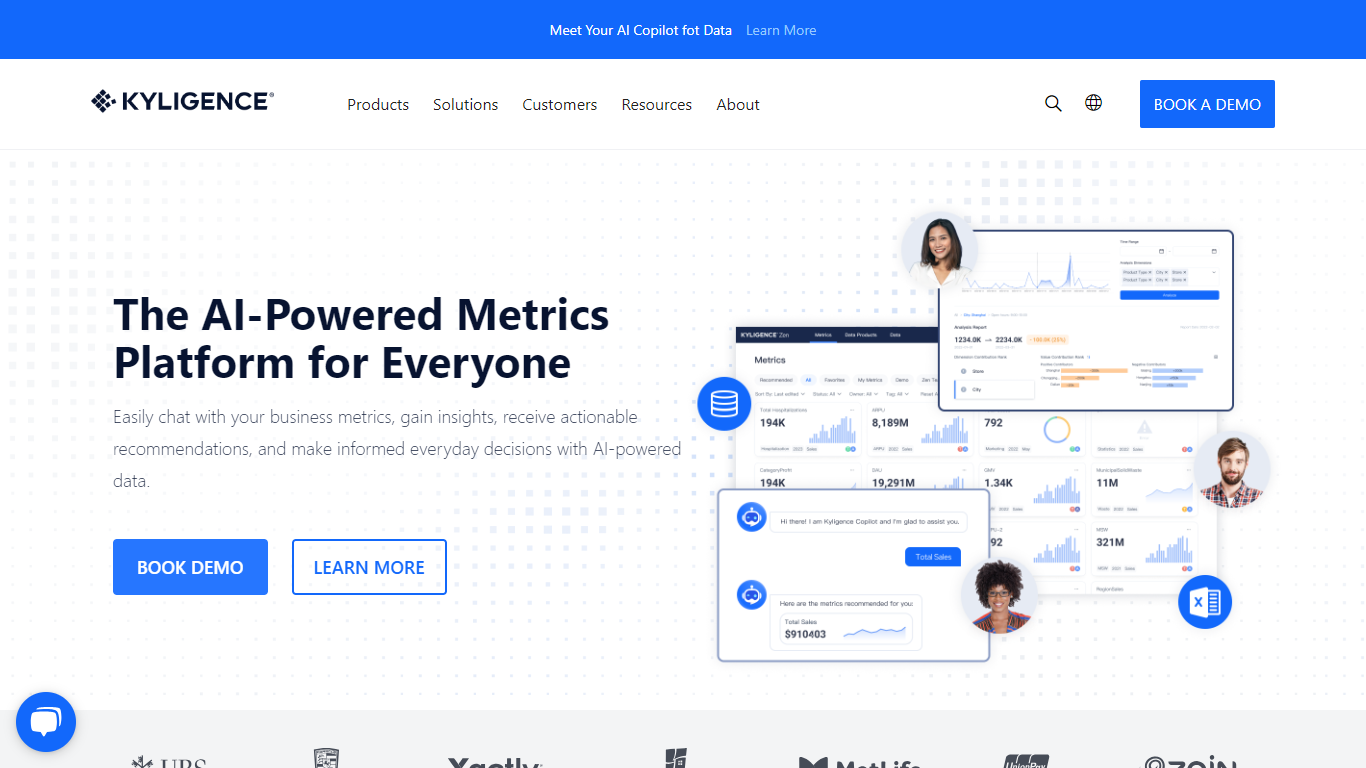

What is Kyligence?
Kyligence is a metrics and analytics platform that lets business teams chat with their KPIs, get recommendations, and make everyday decisions from a single source of truth. Kyligence Zen handles low-code metric definition, cataloging, and analysis, while Kyligence Copilot adds natural language Q&A on top of those metrics.
The company also offers Kyligence Enterprise, an OLAP engine built on Apache Kylin that delivers sub-second SQL queries on petabyte-scale data lakes. A unified semantic layer connects metrics to BI tools like Tableau and Power BI, and open APIs let teams embed Copilot into their own apps or portals.
Founded in 2016 by the creators of Apache Kylin, Kyligence serves financial services, manufacturing, retail, and other enterprise customers including UBS, UnionPay, and Porsche China. The platform runs on SaaS or private cloud deployments, with Azure OpenAI powering the Copilot layer.
Vizly
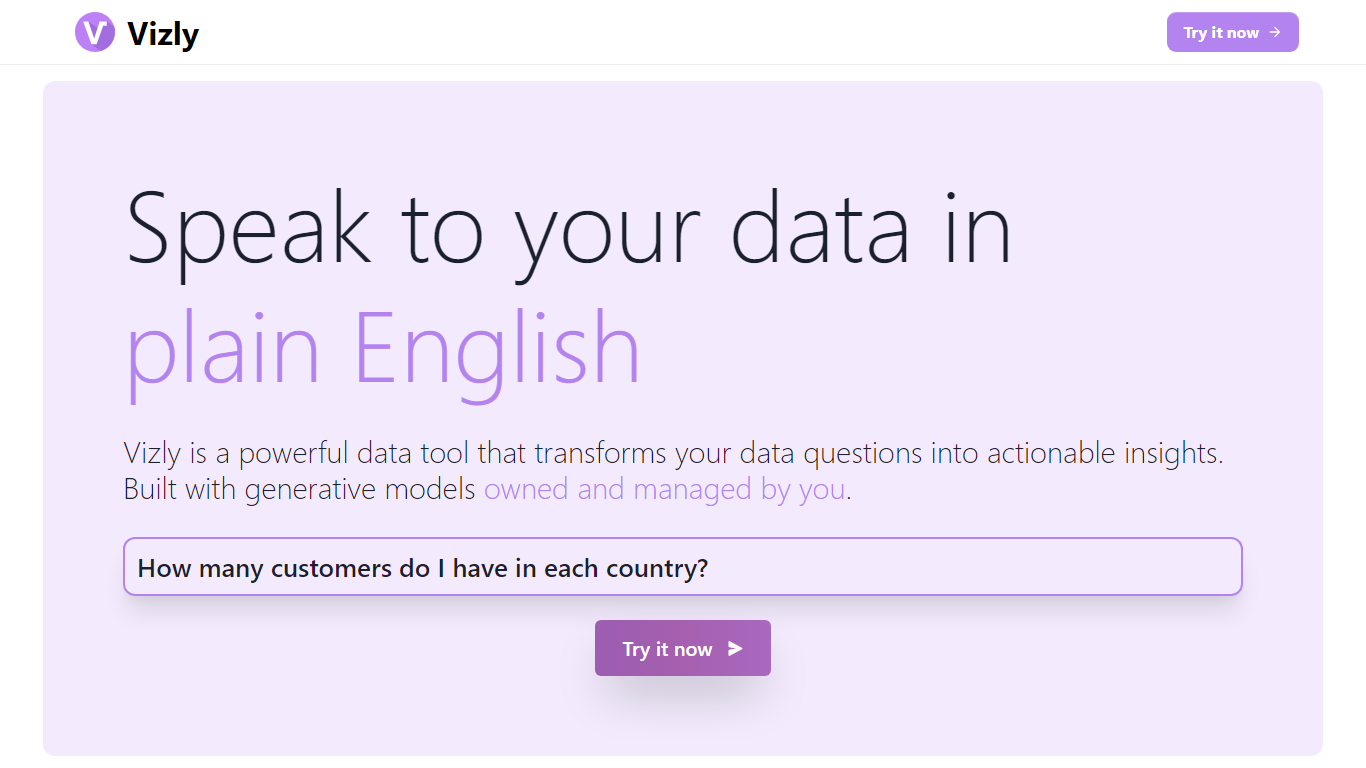
What is Vizly?
Vizly turns spreadsheet uploads into charts and statistical answers through a chat interface. Upload Excel, CSV, or SPSS files, ask questions in plain language, and get interactive Plotly visualizations, regression lines, and correlation matrices back. A private Python sandbox handles machine learning when you need more than summary stats.
Where Tableau and Looker focus on dashboards you configure by hand, Vizly leans on conversational analysis. You describe what you want to know and the app generates visuals on the fly. The trade-off is less pixel-perfect dashboard control in exchange for faster exploratory analysis.
Vizly suits students, analysts, and researchers in healthcare, finance, and genetics who need quick charts without writing notebook code. Premium adds unlimited messages, persistent files between sessions, and high-performance coding environments for heavier workloads.
Kyligence Upvotes
Vizly Upvotes
Kyligence Top Features
Chat with business metrics in plain language through Kyligence Copilot
Copilot analyzes key metrics in about 10 seconds and surfaces root causes in 20
Low-code metrics catalog to define, store, and share KPIs across teams
Sub-second SQL on PB-scale datasets via the Apache Kylin-based OLAP engine
Embed Copilot into apps with open APIs and roughly 10 lines of code
Connects to Tableau, Power BI, Excel, and existing BI workflows
Vizly Top Features
Chat interface generates Plotly visualizations and statistical analysis from uploaded files
Supports Excel, CSV, and SPSS with built-in data cleaning tools
Private Python code sandbox for machine learning and predictive modeling
Premium plan offers unlimited messages and persistent files between sessions
Use-case templates for healthcare, finance, and genetic research workflows
Kyligence Category
- Data Science
Vizly Category
- Data Science
Kyligence Pricing Type
- Freemium
Vizly Pricing Type
- Freemium