Latitude vs Vizly
In the battle of Latitude vs Vizly, which AI tool comes out on top? We compare reviews, pricing, alternatives, upvotes, features, and more.
Which one is better? Latitude or Vizly?
Upon comparing Latitude with Vizly, which are both AI-powered tools, Both tools have received the same number of upvotes from aitools.fyi users. Be a part of the decision-making process. Your vote could determine the winner.
Does the result make you go "hmm"? Cast your vote and turn that frown upside down!
Latitude

What is Latitude?
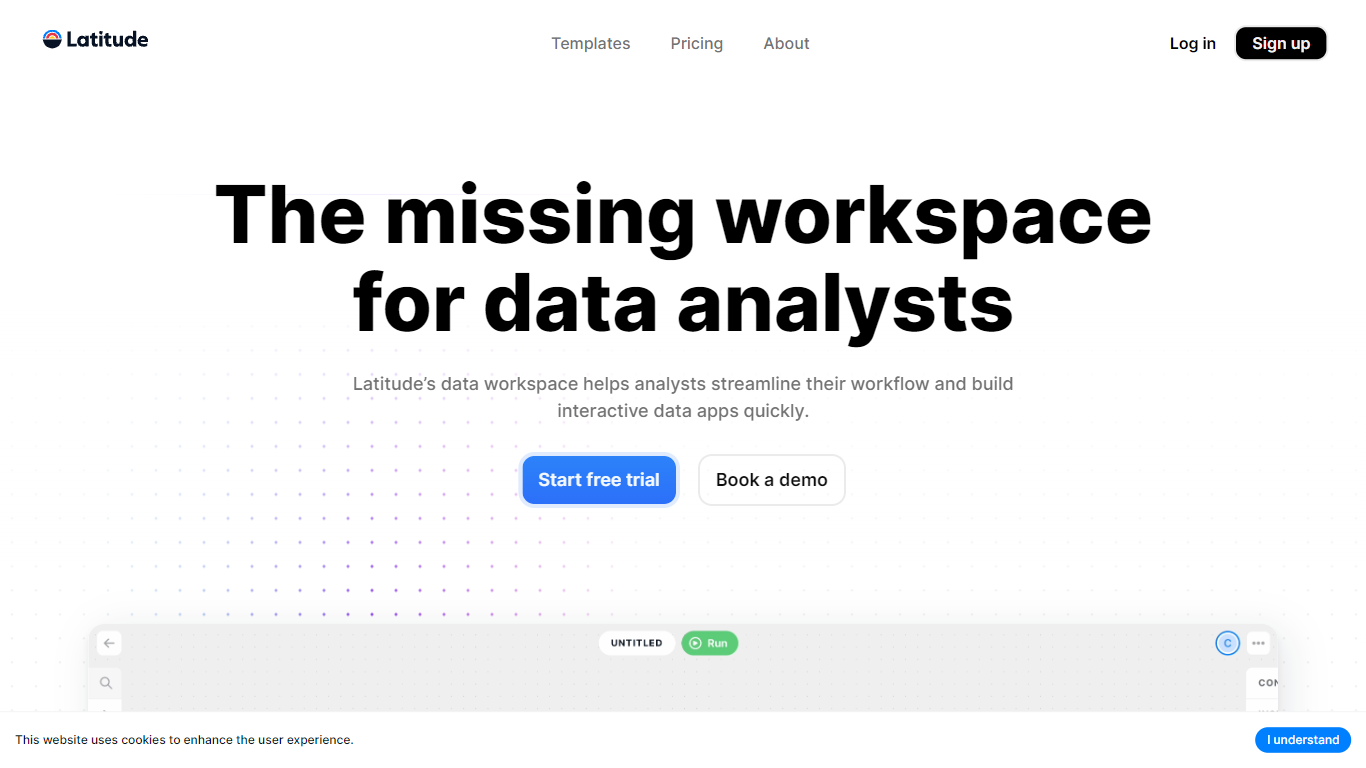
Latitude traces AI agents in production, clusters failures into issues, and can dispatch Claude Code or Cursor with sample traces when a signal escalates. Teams get semantic session search, conversation intelligence, and OpenTelemetry-compatible ingestion without adopting a proprietary trace format.
Generic log tools leave you triaging individual traces by hand. Latitude groups similar failures into issues with trends, affected users, and example spans, then turns validated production traces into versioned datasets for evals. Its newer agent dispatch flow sends coding agents the full context plus a deep link so they can open a pull request with a minimal fix instead of handing engineers another ticket.
The product targets teams shipping agent products who need analytics beyond raw telemetry. Setup is advertised at under five minutes via the Latitude SDK or an existing OTEL pipeline. Paid tiers add longer retention, SOC 2 and ISO 27001 reports, and enterprise deployment options with SAML SSO and European data residency.
Vizly
What is Vizly?
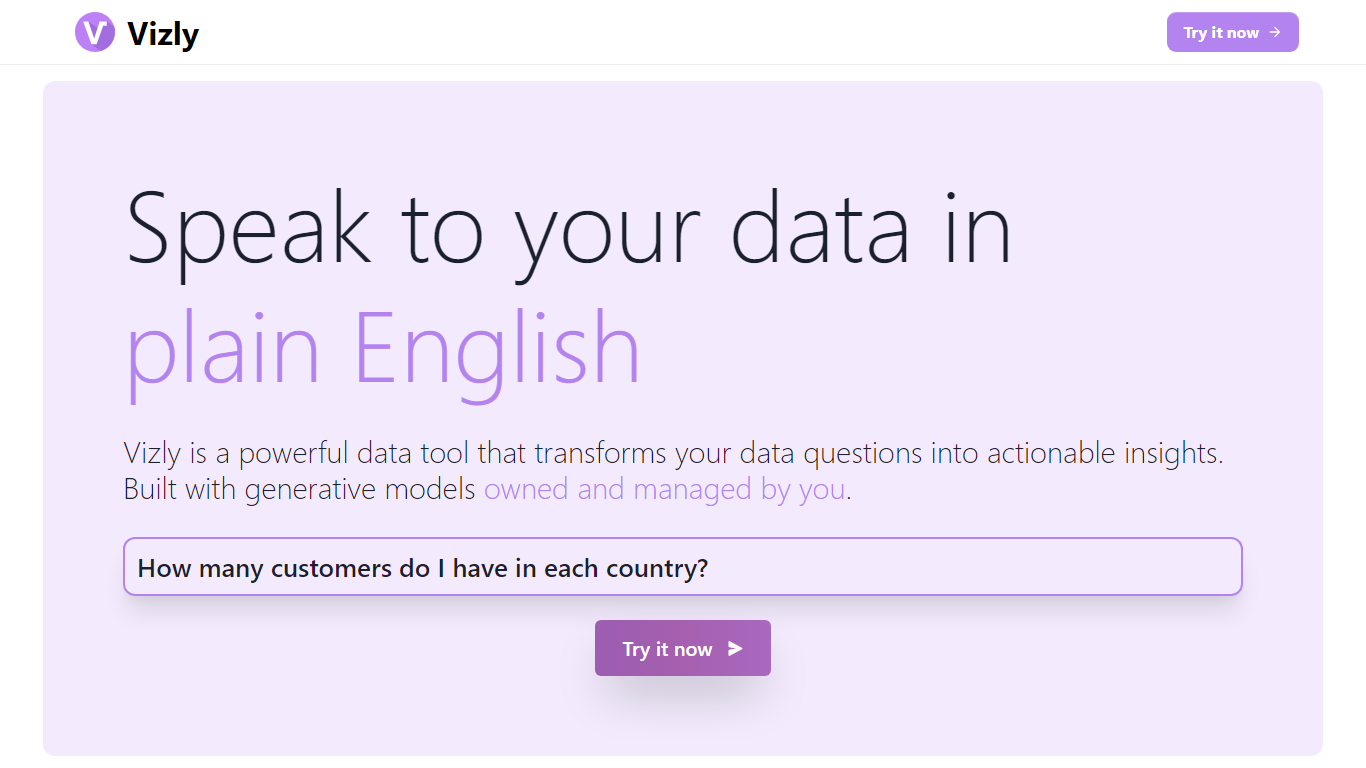
Vizly turns spreadsheet uploads into charts and statistical answers through a chat interface. Upload Excel, CSV, or SPSS files, ask questions in plain language, and get interactive Plotly visualizations, regression lines, and correlation matrices back. A private Python sandbox handles machine learning when you need more than summary stats.
Where Tableau and Looker focus on dashboards you configure by hand, Vizly leans on conversational analysis. You describe what you want to know and the app generates visuals on the fly. The trade-off is less pixel-perfect dashboard control in exchange for faster exploratory analysis.
Vizly suits students, analysts, and researchers in healthcare, finance, and genetics who need quick charts without writing notebook code. Premium adds unlimited messages, persistent files between sessions, and high-performance coding environments for heavier workloads.
Latitude Upvotes
Vizly Upvotes
Latitude Top Features
Dispatch Claude Code or Cursor with traces when a signal escalates and open a PR
Semantic search across 100% of agent traces with combined metadata filters
OpenTelemetry-compatible SDK or pipeline ingestion with no proprietary format
Automatic issue clustering with trends, examples, and affected users per pattern
Starter plan includes 20K credits per month and unlimited seats at $0
Latitude MCP server lets coding agents manage projects from the editor
Golden datasets auto-built from validated production traces for regression evals
Vizly Top Features
Chat interface generates Plotly visualizations and statistical analysis from uploaded files
Supports Excel, CSV, and SPSS with built-in data cleaning tools
Private Python code sandbox for machine learning and predictive modeling
Premium plan offers unlimited messages and persistent files between sessions
Use-case templates for healthcare, finance, and genetic research workflows
Latitude Category
- Analytics
Vizly Category
- Data Science
Latitude Pricing Type
- Freemium
Vizly Pricing Type
- Freemium