Quadratic vs Vizly
Compare Quadratic vs Vizly and see which AI Data Science tool is better when we compare features, reviews, pricing, alternatives, upvotes, etc.
Which one is better? Quadratic or Vizly?
When we compare Quadratic with Vizly, which are both AI-powered data science tools, Quadratic stands out as the clear frontrunner in terms of upvotes. Quadratic has received 7 upvotes from aitools.fyi users, while Vizly has received 6 upvotes.
Don't agree with the result? Cast your vote and be a part of the decision-making process!
Quadratic

What is Quadratic?
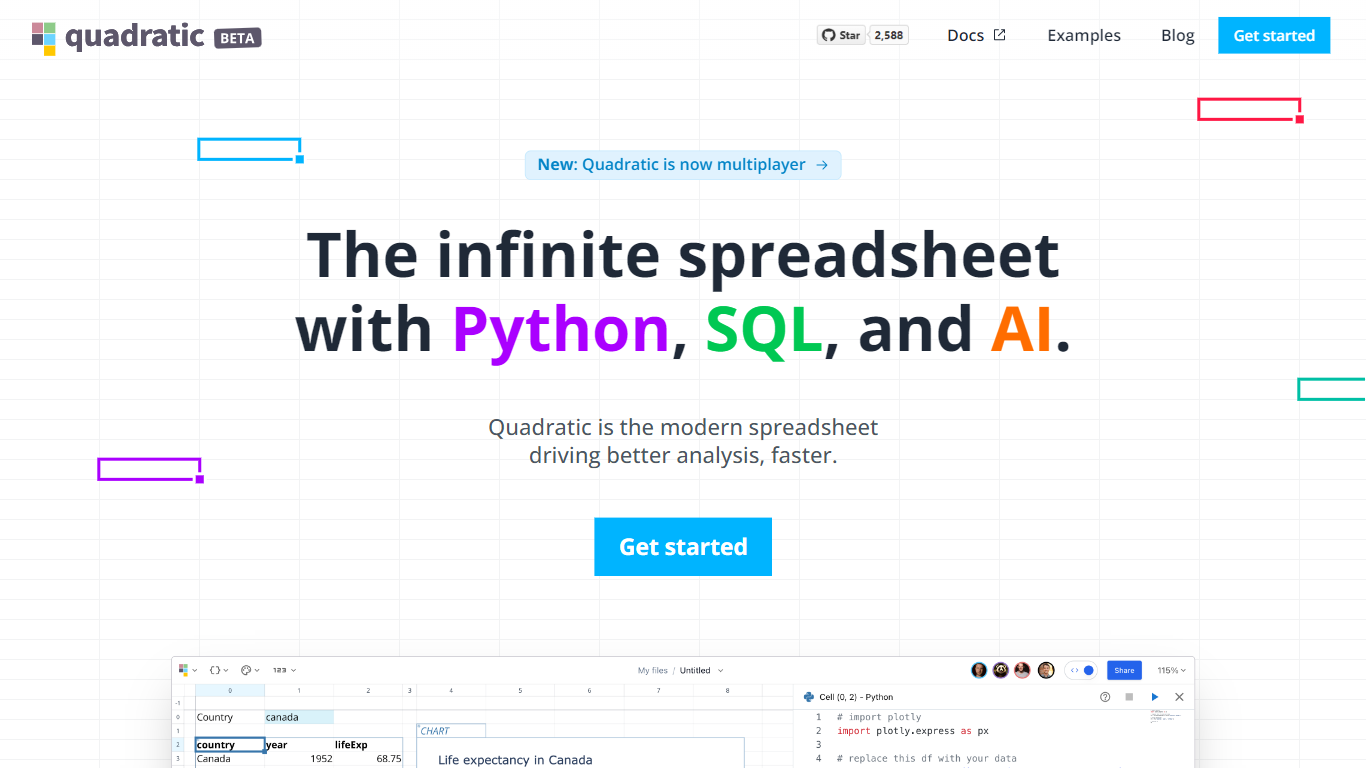
Quadratic is an AI spreadsheet that connects live data from databases, finance tools, analytics platforms, and files into one workspace. You can ask questions in plain language, run Python or SQL in cells, and get answers you can open and verify instead of trusting a black box.
It pulls from sources like Postgres, QuickBooks, Google Analytics, Mixpanel, Plaid, and Snowflake, then unifies everything in a familiar grid. Teams use it for forecasting, exploratory analysis, and reporting without exporting CSVs or juggling disconnected tools.
Quadratic also supports MCP so agents like Claude, Cursor, and ChatGPT can read and write spreadsheet data, plus a REST API for embedding spreadsheet workflows in your own apps. The product is SOC 2 and HIPAA certified.
Vizly
What is Vizly?
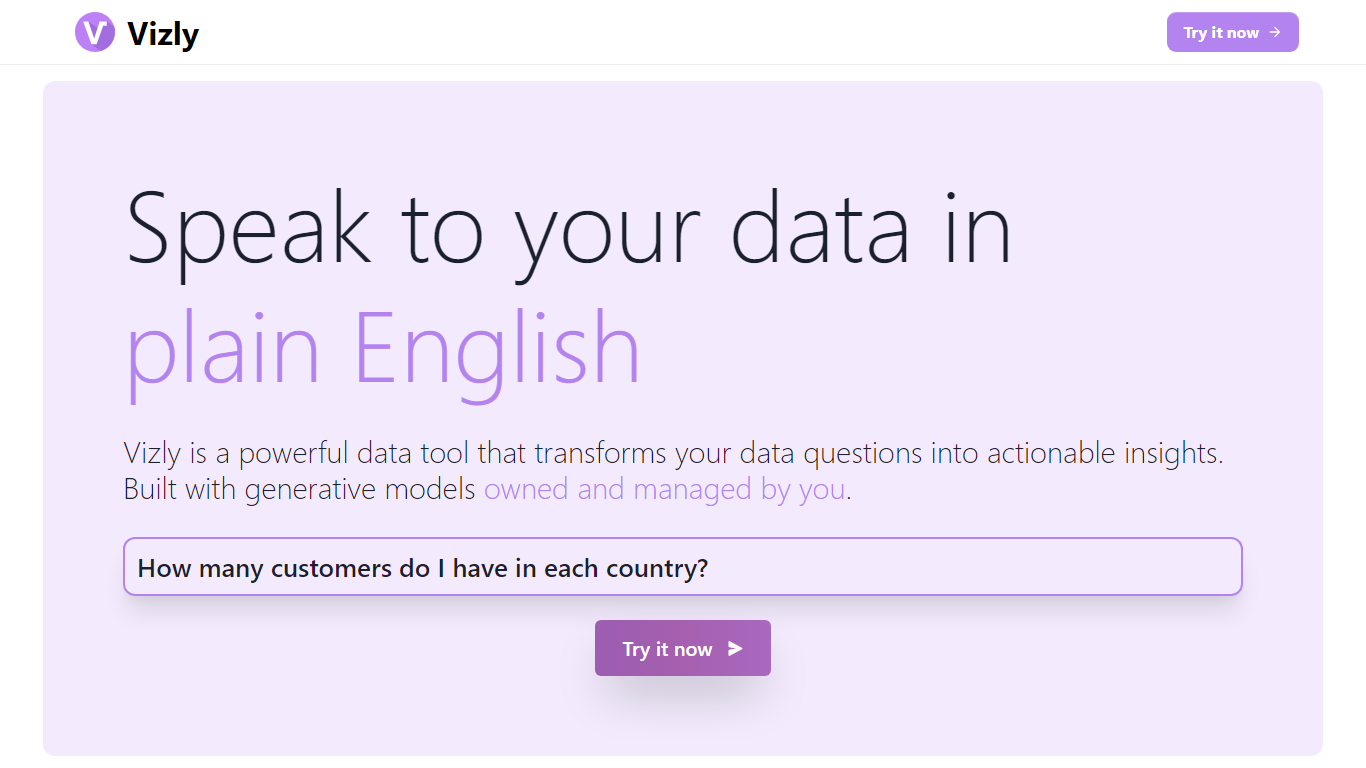
Vizly turns spreadsheet uploads into charts and statistical answers through a chat interface. Upload Excel, CSV, or SPSS files, ask questions in plain language, and get interactive Plotly visualizations, regression lines, and correlation matrices back. A private Python sandbox handles machine learning when you need more than summary stats.
Where Tableau and Looker focus on dashboards you configure by hand, Vizly leans on conversational analysis. You describe what you want to know and the app generates visuals on the fly. The trade-off is less pixel-perfect dashboard control in exchange for faster exploratory analysis.
Vizly suits students, analysts, and researchers in healthcare, finance, and genetics who need quick charts without writing notebook code. Premium adds unlimited messages, persistent files between sessions, and high-performance coding environments for heavier workloads.
Quadratic Upvotes
Vizly Upvotes
Quadratic Top Features
Connect Postgres, QuickBooks, Plaid, Google Analytics, Mixpanel, and other sources for live spreadsheet data
Ask questions in natural language and get auditable Python or SQL cells you can edit and verify
Unify databases, spreadsheets, PDFs, and APIs into one connected workspace
Use MCP so Claude, Cursor, ChatGPT, and other agents can read and write spreadsheet cells
Trigger AI runs and read or write cells through the Quadratic REST API
Vizly Top Features
Chat interface generates Plotly visualizations and statistical analysis from uploaded files
Supports Excel, CSV, and SPSS with built-in data cleaning tools
Private Python code sandbox for machine learning and predictive modeling
Premium plan offers unlimited messages and persistent files between sessions
Use-case templates for healthcare, finance, and genetic research workflows
Quadratic Category
- Data Science
Vizly Category
- Data Science
Quadratic Pricing Type
- Freemium
Vizly Pricing Type
- Freemium