RAGnexus vs Vizly
In the clash of RAGnexus vs Vizly, which AI Data Science tool emerges victorious? We assess reviews, pricing, alternatives, features, upvotes, and more.
If you had to choose between RAGnexus and Vizly, which one would you go for?
Let's take a closer look at RAGnexus and Vizly, both of which are AI-driven data science tools, and see what sets them apart. The upvote count reveals a draw, with both tools earning the same number of upvotes. Be a part of the decision-making process. Your vote could determine the winner.
You don't agree with the result? Cast your vote to help us decide!
RAGnexus
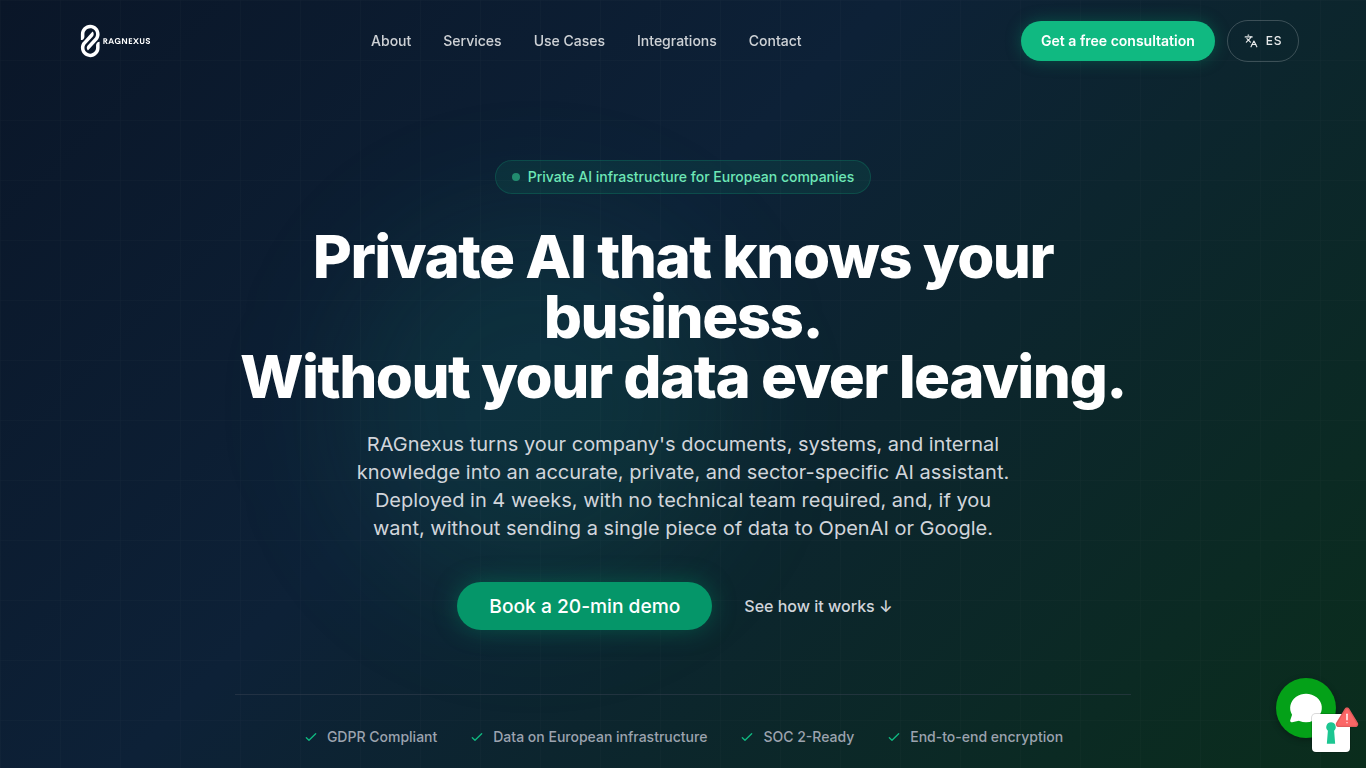

What is RAGnexus?
RAGnexus builds private AI assistants for European companies that need answers grounded in their own documents and systems. It connects to the tools where your knowledge already lives, indexes that content into a secure knowledge base, and deploys an assistant your team can query in natural language with cited sources.
The product is designed around data sovereignty. Deployments run on European infrastructure, with options that keep data off third-party model APIs entirely. RAGnexus targets regulated sectors like law, healthcare, and consulting, where confidentiality and GDPR compliance are non-negotiable.
Setup is handled as a managed service. RAGnexus integrates with your existing stack, handles indexing and maintenance, and delivers a working assistant in roughly four weeks for cloud deployments or eight to twelve weeks for fully sovereign on-premises setups.
Vizly
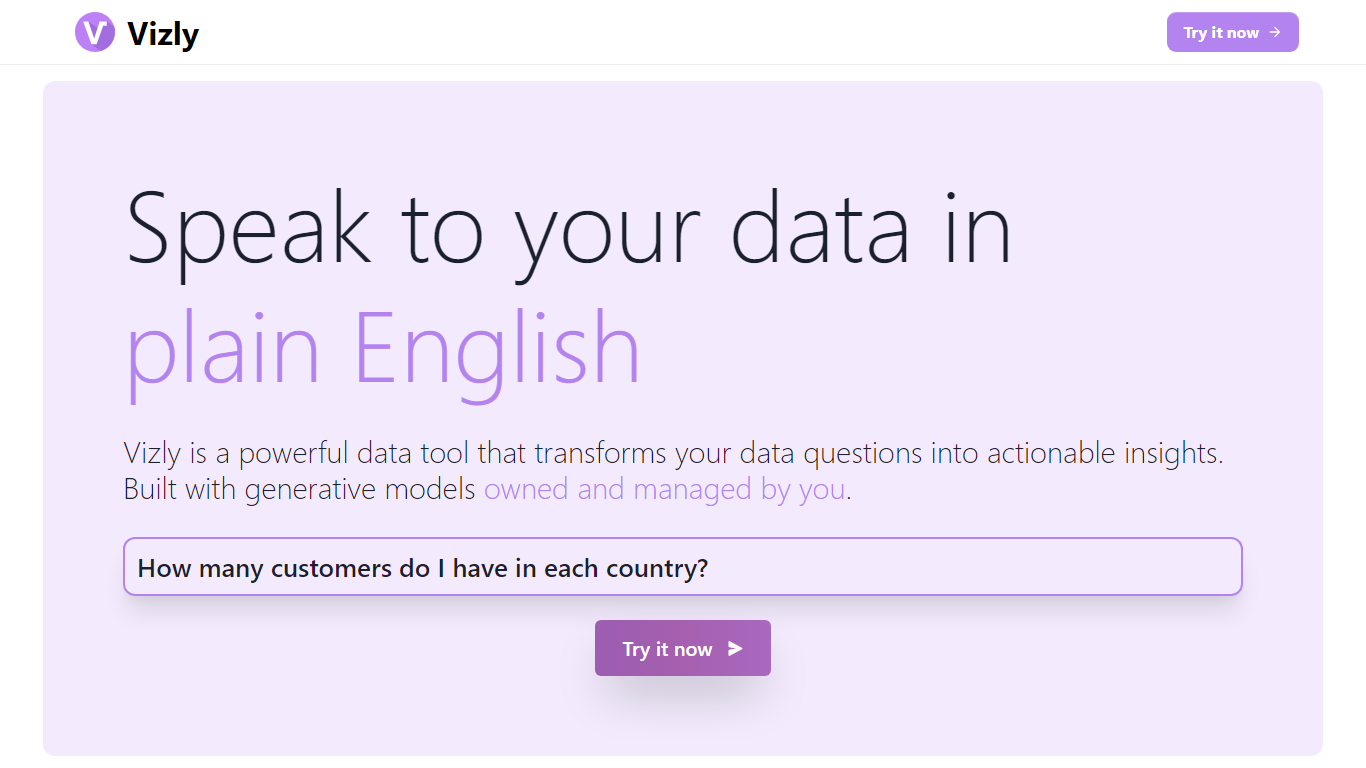
What is Vizly?
Vizly turns spreadsheet uploads into charts and statistical answers through a chat interface. Upload Excel, CSV, or SPSS files, ask questions in plain language, and get interactive Plotly visualizations, regression lines, and correlation matrices back. A private Python sandbox handles machine learning when you need more than summary stats.
Where Tableau and Looker focus on dashboards you configure by hand, Vizly leans on conversational analysis. You describe what you want to know and the app generates visuals on the fly. The trade-off is less pixel-perfect dashboard control in exchange for faster exploratory analysis.
Vizly suits students, analysts, and researchers in healthcare, finance, and genetics who need quick charts without writing notebook code. Premium adds unlimited messages, persistent files between sessions, and high-performance coding environments for heavier workloads.
RAGnexus Upvotes
Vizly Upvotes
RAGnexus Top Features
Pulls answers from your company's documents across SharePoint, Google Drive, Notion, Slack, and 40+ other integrations
Cites the exact source document for every response so teams can verify before acting
Deploys on European infrastructure with end-to-end encryption and GDPR compliance built in
Offers a sovereign mode where queries never leave your own servers or dedicated European cloud
Gets your team running in about four weeks without needing an internal engineering team
Respects existing permission structures so users only see documents they already have access to
Vizly Top Features
Chat interface generates Plotly visualizations and statistical analysis from uploaded files
Supports Excel, CSV, and SPSS with built-in data cleaning tools
Private Python code sandbox for machine learning and predictive modeling
Premium plan offers unlimited messages and persistent files between sessions
Use-case templates for healthcare, finance, and genetic research workflows
RAGnexus Category
- Data Science
Vizly Category
- Data Science
RAGnexus Pricing Type
- Paid
Vizly Pricing Type
- Freemium