Vizly vs Kanaries
In the clash of Vizly vs Kanaries, which AI Data Science tool emerges victorious? We assess reviews, pricing, alternatives, features, upvotes, and more.
When we put Vizly and Kanaries head to head, which one emerges as the victor?
Let's take a closer look at Vizly and Kanaries, both of which are AI-driven data science tools, and see what sets them apart. There's no clear winner in terms of upvotes, as both tools have received the same number. Every vote counts! Cast yours and contribute to the decision of the winner.
Feeling rebellious? Cast your vote and shake things up!
Vizly

What is Vizly?
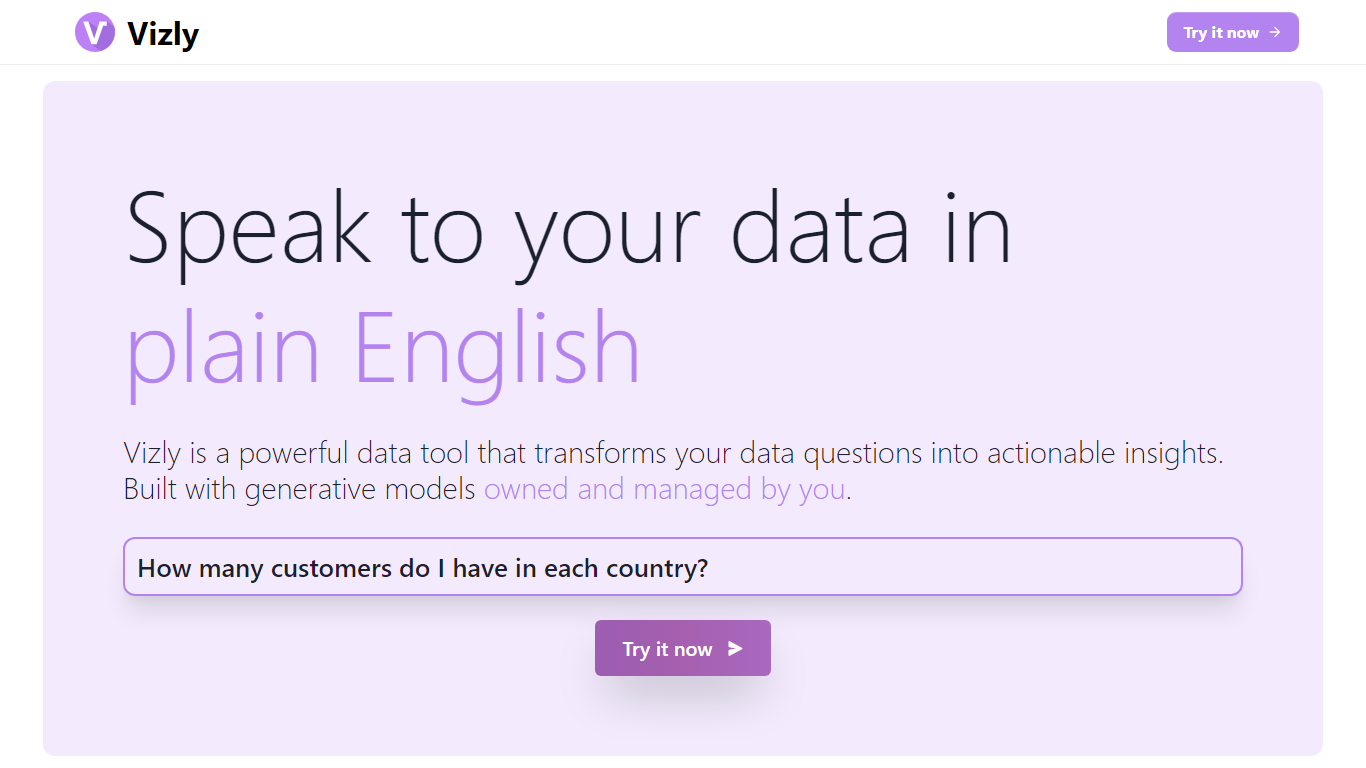
Vizly turns spreadsheet uploads into charts and statistical answers through a chat interface. Upload Excel, CSV, or SPSS files, ask questions in plain language, and get interactive Plotly visualizations, regression lines, and correlation matrices back. A private Python sandbox handles machine learning when you need more than summary stats.
Where Tableau and Looker focus on dashboards you configure by hand, Vizly leans on conversational analysis. You describe what you want to know and the app generates visuals on the fly. The trade-off is less pixel-perfect dashboard control in exchange for faster exploratory analysis.
Vizly suits students, analysts, and researchers in healthcare, finance, and genetics who need quick charts without writing notebook code. Premium adds unlimited messages, persistent files between sessions, and high-performance coding environments for heavier workloads.
Kanaries
What is Kanaries?
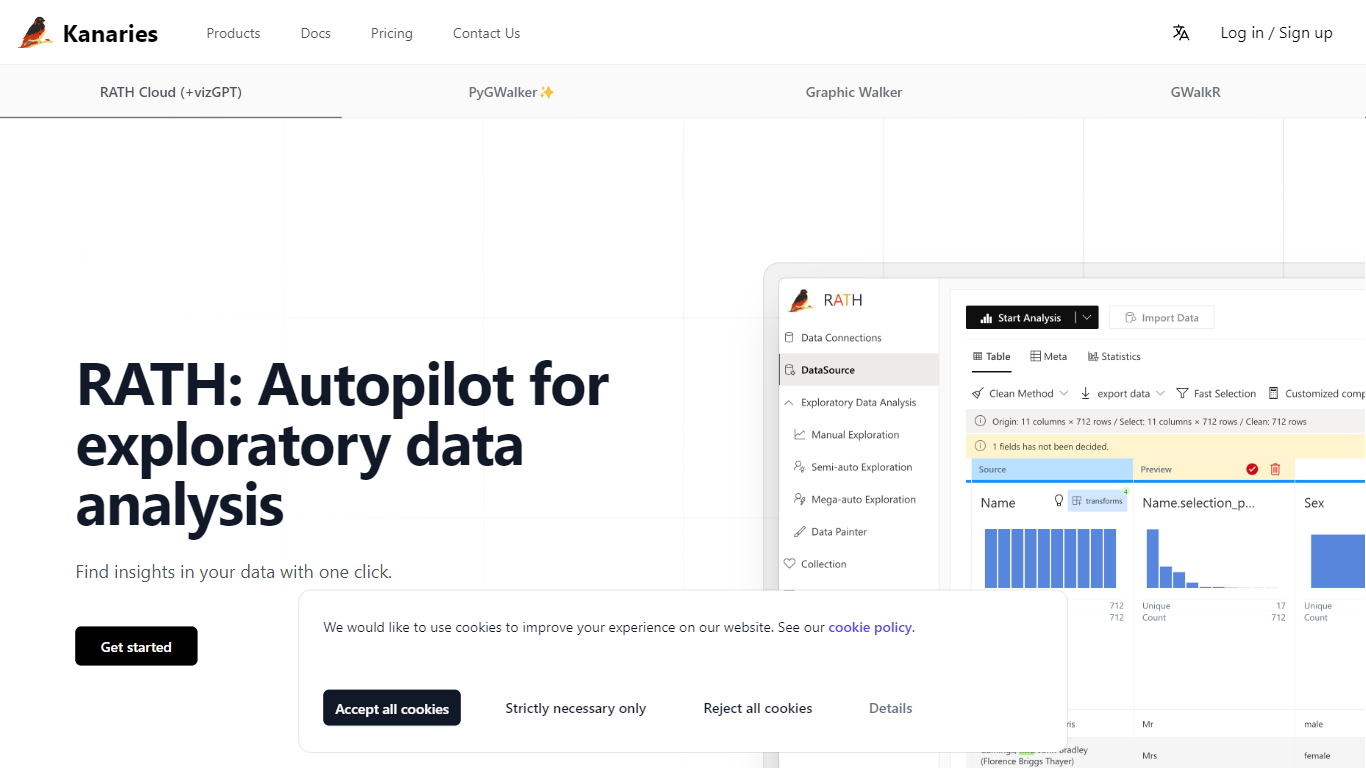
Kanaries turns pandas DataFrames, R tables, and warehouse databases into interactive charts you can explore with drag-and-drop or plain-language chat. PyGWalker adds one-line visualization inside Jupyter notebooks, GWalkR does the same in RStudio, and the cloud workspace connects to MySQL, PostgreSQL, Snowflake, and DuckDB without writing SQL by hand.
Most BI tools assume you already built a dashboard. Kanaries targets the exploration phase: VizChat lets you ask questions in natural language, Runcell.dev adds an AI code agent inside Jupyter, and Graphic Walker embeds as a React component for custom apps. The product family spans notebook plugins, a desktop editor, and a hosted workspace rather than a single chart builder.
Data analysts, notebook-heavy teams, and educators who need shareable charts without a full engineering lift are the fit. Pro unlocks GPT-powered exploration and team collaboration; the Education tier is free for verified school email addresses.
Vizly Upvotes
Kanaries Upvotes
Vizly Top Features
Chat interface generates Plotly visualizations and statistical analysis from uploaded files
Supports Excel, CSV, and SPSS with built-in data cleaning tools
Private Python code sandbox for machine learning and predictive modeling
Premium plan offers unlimited messages and persistent files between sessions
Use-case templates for healthcare, finance, and genetic research workflows
Kanaries Top Features
PyGWalker turns a pandas DataFrame into an interactive visual analytics app with one line of code
VizChat answers data questions in natural language and returns charts from connected databases
Connects to MySQL, PostgreSQL, Snowflake, DuckDB, and other sources from the cloud workspace
Runcell.dev AI code agent runs inside Jupyter Notebook with inline completion and next-step suggestions
GWalkR embeds interactive charts in RStudio and R Markdown from a single function call
Pro plan at $129 per year includes GPT-powered exploration and team dashboard sharing
Graphic Walker component embeds drag-and-drop analytics into React, Vue, or Angular apps
Vizly Category
- Data Science
Kanaries Category
- Data Science
Vizly Pricing Type
- Freemium
Kanaries Pricing Type
- Freemium