Vizly vs Scale
When comparing Vizly vs Scale, which AI Data Science tool shines brighter? We look at pricing, alternatives, upvotes, features, reviews, and more.
In a comparison between Vizly and Scale, which one comes out on top?
When we put Vizly and Scale side by side, both being AI-powered data science tools, There's no clear winner in terms of upvotes, as both tools have received the same number. Every vote counts! Cast yours and contribute to the decision of the winner.
Does the result make you go "hmm"? Cast your vote and turn that frown upside down!
Vizly

What is Vizly?
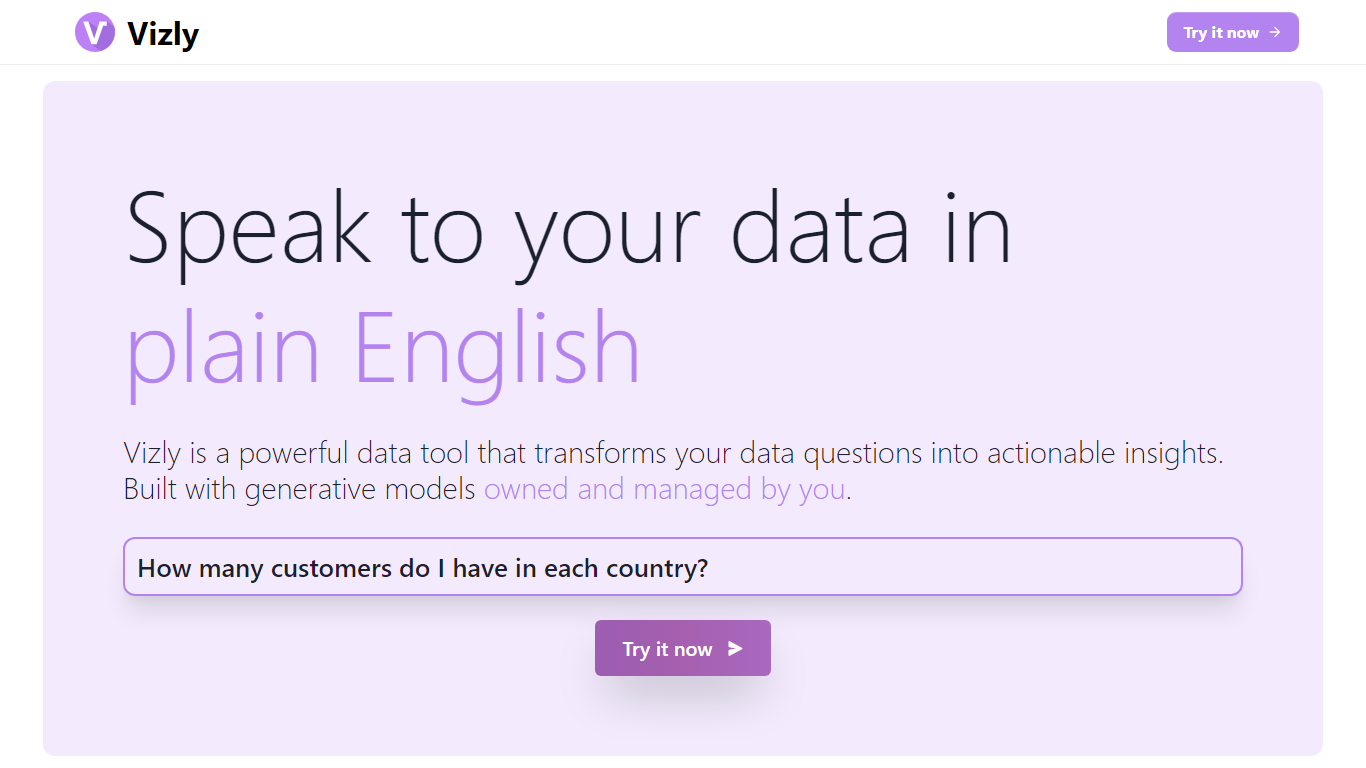
Vizly turns spreadsheet uploads into charts and statistical answers through a chat interface. Upload Excel, CSV, or SPSS files, ask questions in plain language, and get interactive Plotly visualizations, regression lines, and correlation matrices back. A private Python sandbox handles machine learning when you need more than summary stats.
Where Tableau and Looker focus on dashboards you configure by hand, Vizly leans on conversational analysis. You describe what you want to know and the app generates visuals on the fly. The trade-off is less pixel-perfect dashboard control in exchange for faster exploratory analysis.
Vizly suits students, analysts, and researchers in healthcare, finance, and genetics who need quick charts without writing notebook code. Premium adds unlimited messages, persistent files between sessions, and high-performance coding environments for heavier workloads.
Scale
What is Scale?
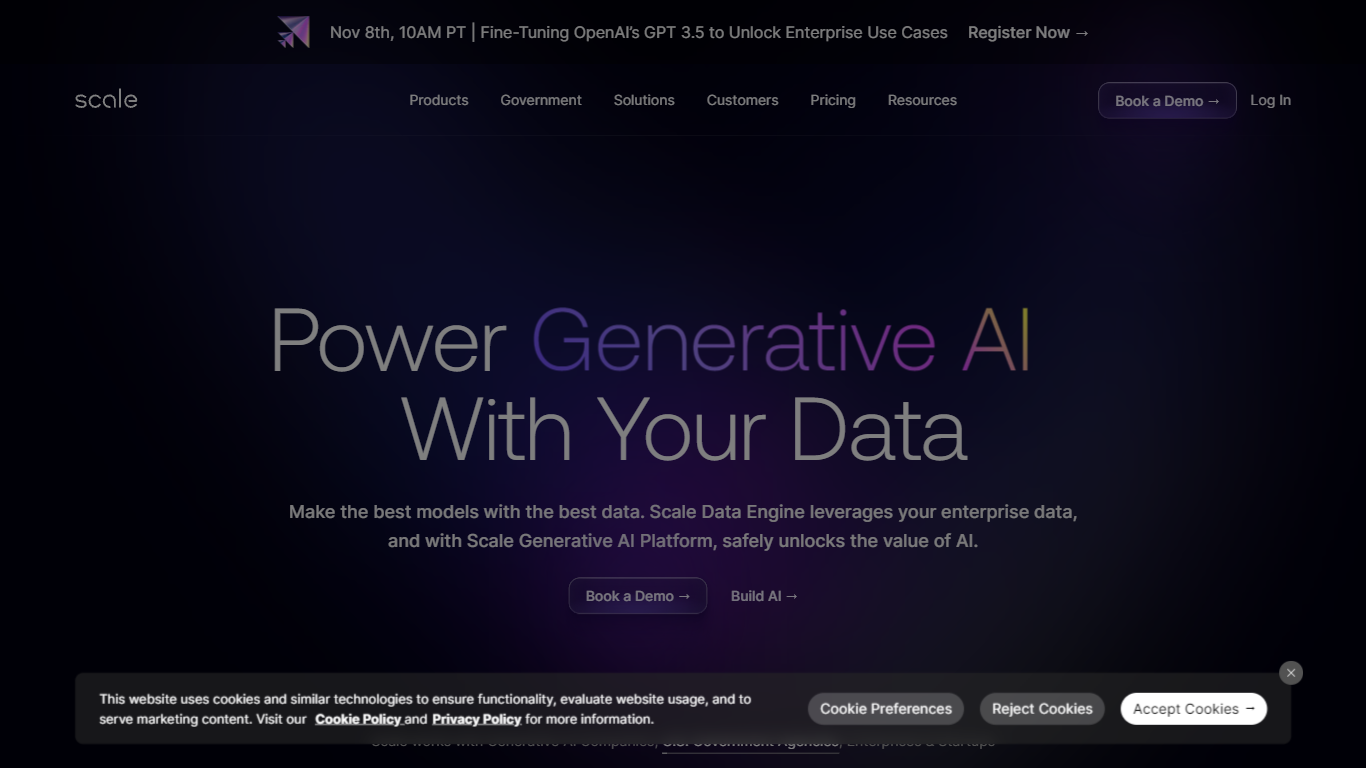
Scale AI supplies training data, model evaluations, and applied AI systems for labs, enterprises, and governments building machine learning products. The company runs the Scale Data Engine for annotation and RLHF, the GenAI Platform for full-stack generative workflows, and Donovan for defense-oriented intelligence work. Customers include Meta, TIME, Instacart, and public sector agencies that need audited, high-volume data pipelines rather than ad hoc labeling spreadsheets.
Where many labeling vendors focus on a single modality or outsource quality control entirely, Scale combines ML-assisted pre-labeling with layered human review across text, image, video, and 3D sensor fusion including LiDAR. Its Generative AI Data Engine adds prompt generation, red teaming, and benchmark evaluations in one loop, so teams can train, stress-test, and compare frontier models without stitching together separate vendors.
Scale fits ML teams shipping self-driving perception, document NLP, generative assistants, and government programs that demand traceable data provenance. Teams book a demo for custom contracts because pricing is enterprise sales only, not a self-serve checkout page.
Vizly Upvotes
Scale Upvotes
Vizly Top Features
Chat interface generates Plotly visualizations and statistical analysis from uploaded files
Supports Excel, CSV, and SPSS with built-in data cleaning tools
Private Python code sandbox for machine learning and predictive modeling
Premium plan offers unlimited messages and persistent files between sessions
Use-case templates for healthcare, finance, and genetic research workflows
Scale Top Features
15 billion human decisions logged for training AI models
Annotation pipelines cover text, image, video, and 3D LiDAR sensor fusion
Generative AI Data Engine handles RLHF, red teaming, and model evaluation in one workflow
Supports projects from small experiments to high-volume production labeling
Trusted by Meta, Instacart, and TIME for production-scale data needs
Documentation covers GenAI Platform, GenAI Data Engine, and automotive workflows
Vizly Category
- Data Science
Scale Category
- Data Science
Vizly Pricing Type
- Freemium
Scale Pricing Type
- Paid