Vizly vs STRING
Explore the showdown between Vizly vs STRING and find out which AI Data Science tool wins. We analyze upvotes, features, reviews, pricing, alternatives, and more.
When comparing Vizly and STRING, which one rises above the other?
When we contrast Vizly with STRING, both of which are exceptional AI-operated data science tools, and place them side by side, we can spot several crucial similarities and divergences. Both tools are equally favored, as indicated by the identical upvote count. Join the aitools.fyi users in deciding the winner by casting your vote.
Disagree with the result? Upvote your favorite tool and help it win!
Vizly
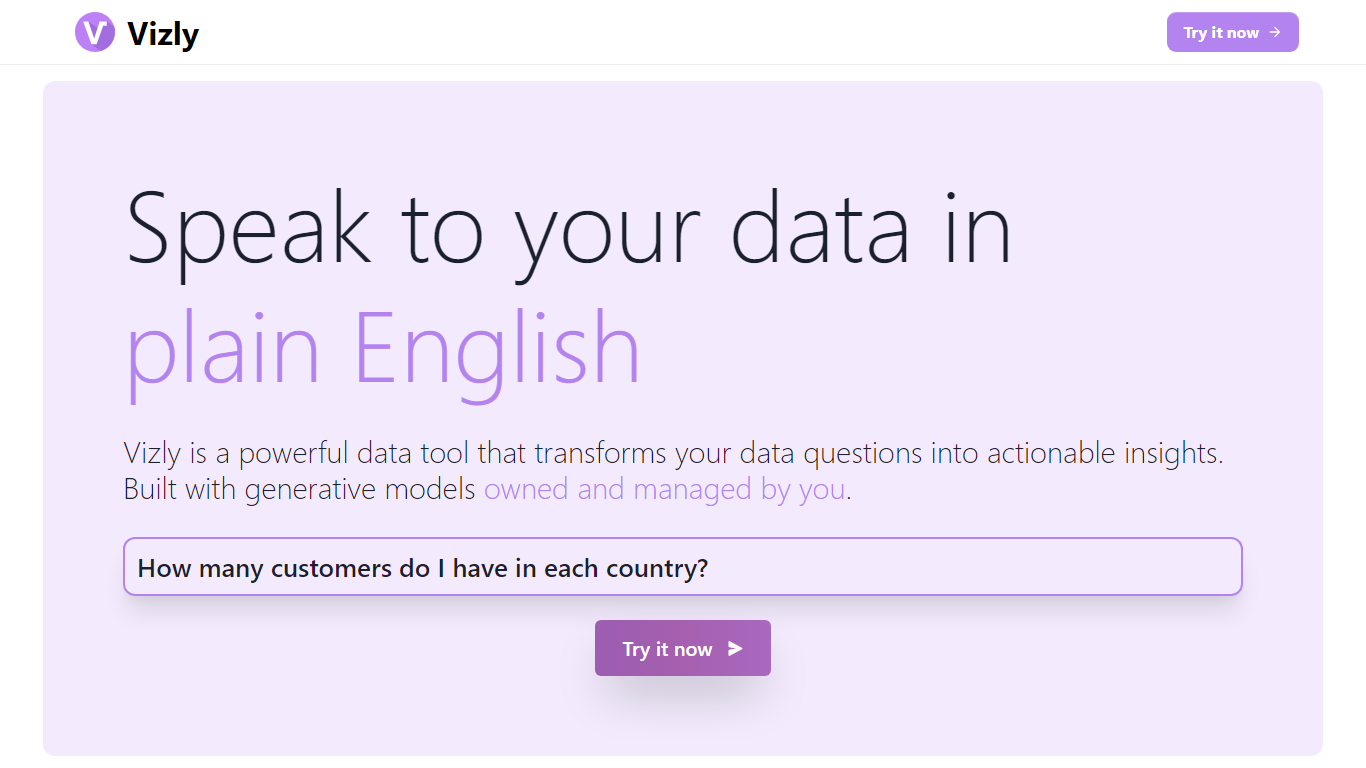

What is Vizly?
Vizly turns spreadsheet uploads into charts and statistical answers through a chat interface. Upload Excel, CSV, or SPSS files, ask questions in plain language, and get interactive Plotly visualizations, regression lines, and correlation matrices back. A private Python sandbox handles machine learning when you need more than summary stats.
Where Tableau and Looker focus on dashboards you configure by hand, Vizly leans on conversational analysis. You describe what you want to know and the app generates visuals on the fly. The trade-off is less pixel-perfect dashboard control in exchange for faster exploratory analysis.
Vizly suits students, analysts, and researchers in healthcare, finance, and genetics who need quick charts without writing notebook code. Premium adds unlimited messages, persistent files between sessions, and high-performance coding environments for heavier workloads.
STRING
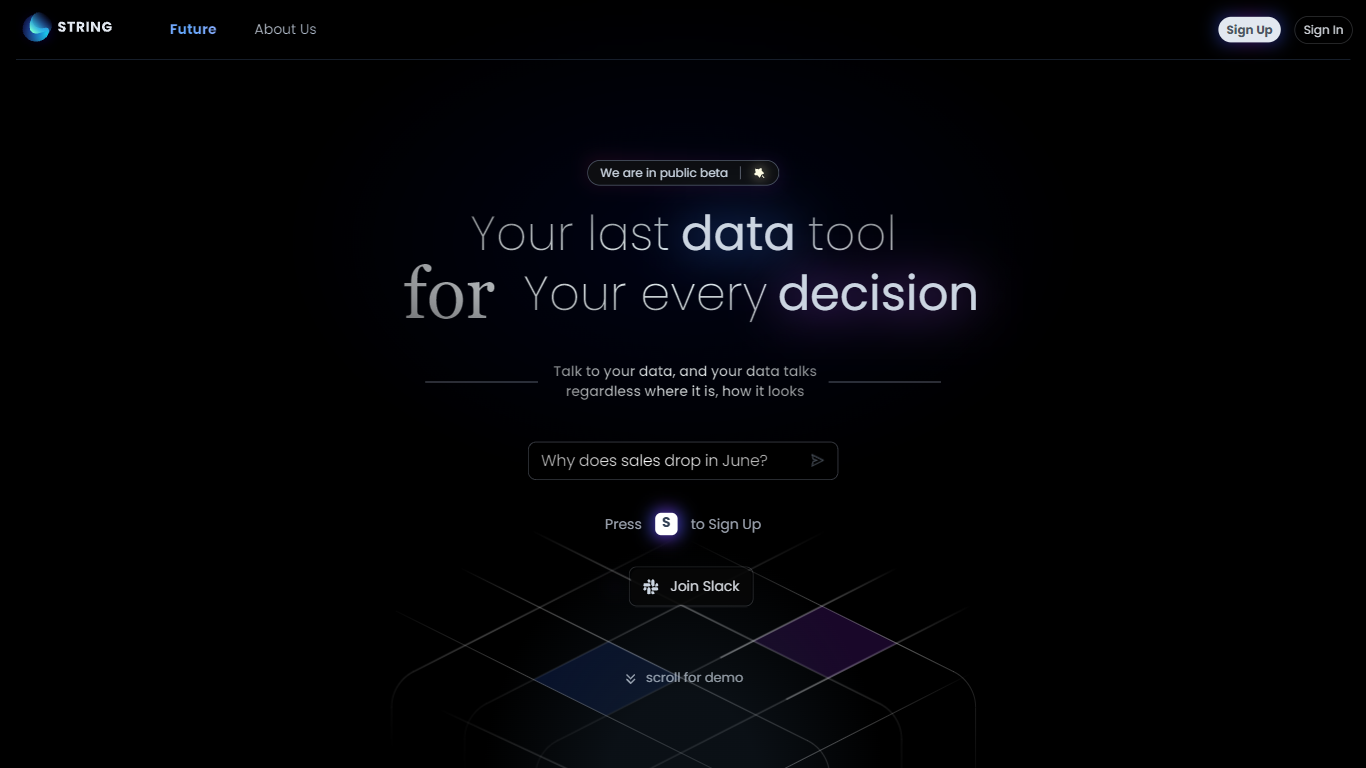
What is STRING?
STRING lets you talk to your data through a conversational analytics interface marketed as your last data tool. You sign up for the public beta, connect sources wherever they live, and ask questions in natural language instead of building dashboards first. The product pitch centers on decisions: your data answers back regardless of format or location.
Legacy BI stacks expect hours of SQL and chart assembly before you get a useful answer. STRING's team, with backgrounds at Google, Uber, CMU, and UW, frames the product around AGI-style analytics that listens, understands unstructured text, and takes initiative beyond rigid queries. The Future page contrasts this with older tools that crunch structured tables slowly.
Data analysts, product managers, and operators who want quick answers without standing up a full BI project fit STRING best. It is still in public beta with Slack community access, so teams should expect evolving features rather than a finished enterprise contract page.
Vizly Upvotes
STRING Upvotes
Vizly Top Features
Chat interface generates Plotly visualizations and statistical analysis from uploaded files
Supports Excel, CSV, and SPSS with built-in data cleaning tools
Private Python code sandbox for machine learning and predictive modeling
Premium plan offers unlimited messages and persistent files between sessions
Use-case templates for healthcare, finance, and genetic research workflows
STRING Top Features
Natural language interface to query data without pre-built dashboard workflows
Public beta signup with Slack community invite for early users
Designed to handle structured databases and unstructured sources like docs and notes
Team includes alumni from Google, Uber, Carnegie Mellon, and University of Washington
Slack community invite linked on homepage for public beta testers
Future roadmap targets proactive analytics that initiates insights beyond user prompts
Vizly Category
- Data Science
STRING Category
- Data Science
Vizly Pricing Type
- Freemium
STRING Pricing Type
- Freemium