Vizzy vs Vizly
In the contest of Vizzy vs Vizly, which AI Data Science tool is the champion? We evaluate pricing, alternatives, upvotes, features, reviews, and more.
If you had to choose between Vizzy and Vizly, which one would you go for?
When we examine Vizzy and Vizly, both of which are AI-enabled data science tools, what unique characteristics do we discover? There's no clear winner in terms of upvotes, as both tools have received the same number. Since other aitools.fyi users could decide the winner, the ball is in your court now to cast your vote and help us determine the winner.
You don't agree with the result? Cast your vote to help us decide!
Vizzy

What is Vizzy ?
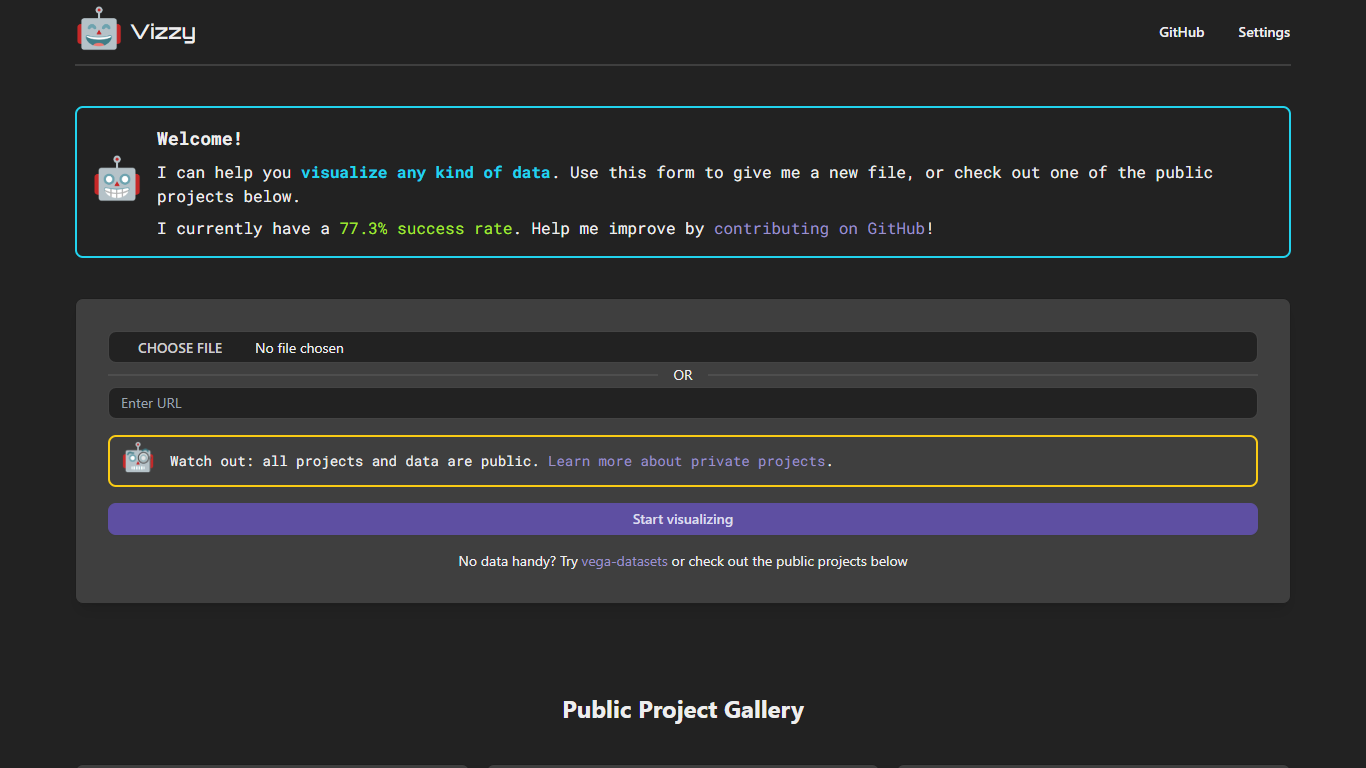
Vizzy is a data visualization platform that leverages Large Language Models (LLMs) to help users quickly transform raw data into clear visual stories. It supports a wide range of data types and formats, allowing both beginners and experienced analysts to create insightful charts, maps, and graphs without deep technical skills. Users connect their own OpenAI API key, ensuring data privacy as keys are stored only in the browser and not on Vizzy's servers. The platform offers a public project gallery showcasing diverse datasets like U.S. state obesity rates and national parks, encouraging exploration and learning. While currently open source and free to use with an OpenAI account, Vizzy plans to introduce paid features such as private projects and user management. Its interface guides users through data upload, exploration, and visualization creation, making complex data accessible and understandable. Vizzy is ideal for educators, researchers, journalists, and data enthusiasts who want rapid, AI-assisted visual analysis without coding.
Vizly
What is Vizly?
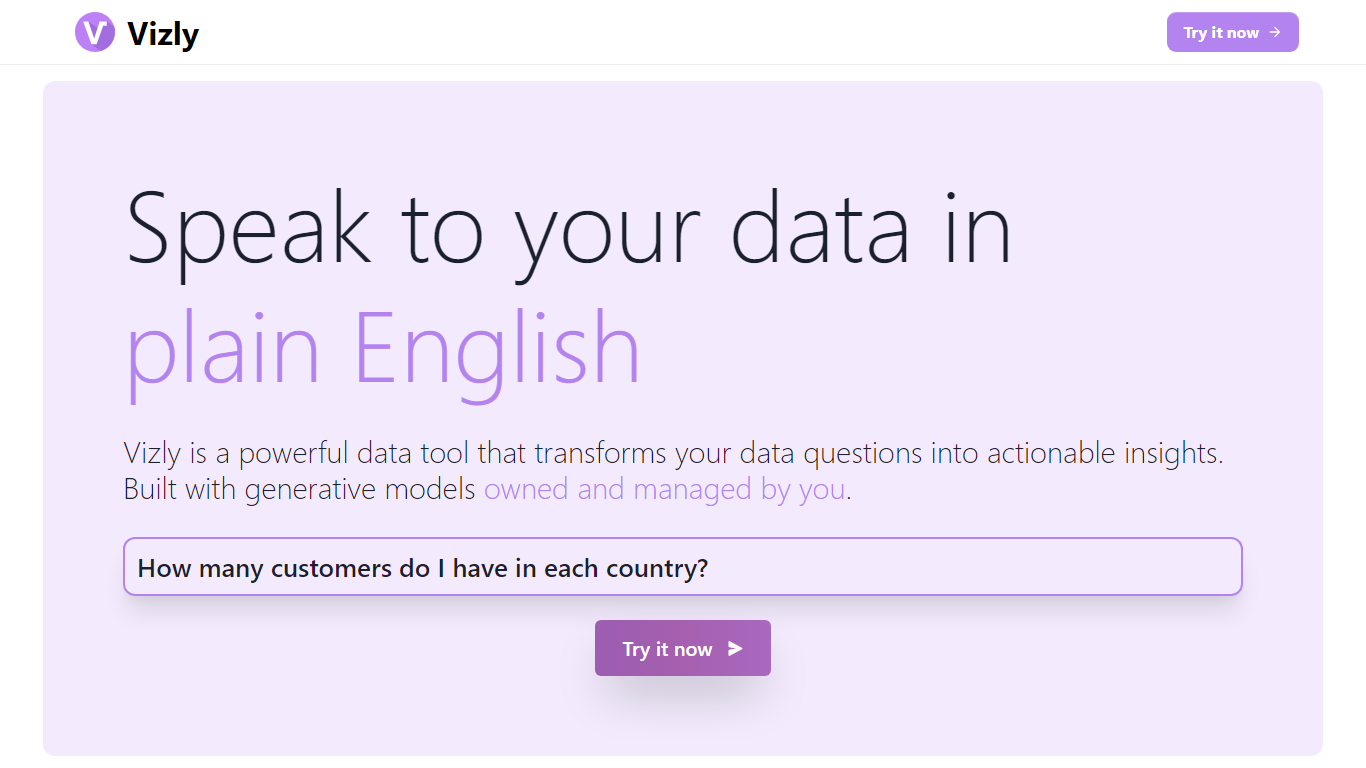
Vizly turns spreadsheet uploads into charts and statistical answers through a chat interface. Upload Excel, CSV, or SPSS files, ask questions in plain language, and get interactive Plotly visualizations, regression lines, and correlation matrices back. A private Python sandbox handles machine learning when you need more than summary stats.
Where Tableau and Looker focus on dashboards you configure by hand, Vizly leans on conversational analysis. You describe what you want to know and the app generates visuals on the fly. The trade-off is less pixel-perfect dashboard control in exchange for faster exploratory analysis.
Vizly suits students, analysts, and researchers in healthcare, finance, and genetics who need quick charts without writing notebook code. Premium adds unlimited messages, persistent files between sessions, and high-performance coding environments for heavier workloads.
Vizzy Upvotes
Vizly Upvotes
Vizzy Top Features
🔑 Connect your own OpenAI API key for secure data processing
📊 Create diverse visualizations like maps, timelines, and heatmaps easily
🌐 Explore and fork public projects to learn and customize visualizations
🛠️ Open source platform allowing community contributions and transparency
📁 Upload CSV or JSON data files directly for instant visualization
Vizly Top Features
Chat interface generates Plotly visualizations and statistical analysis from uploaded files
Supports Excel, CSV, and SPSS with built-in data cleaning tools
Private Python code sandbox for machine learning and predictive modeling
Premium plan offers unlimited messages and persistent files between sessions
Use-case templates for healthcare, finance, and genetic research workflows
Vizzy Category
- Data Science
Vizly Category
- Data Science
Vizzy Pricing Type
- Freemium
Vizly Pricing Type
- Freemium