WhyHive vs Vizly
Compare WhyHive vs Vizly and see which AI Data Science tool is better when we compare features, reviews, pricing, alternatives, upvotes, etc.
Which one is better? WhyHive or Vizly?
When we compare WhyHive with Vizly, which are both AI-powered data science tools, Both tools have received the same number of upvotes from aitools.fyi users. Join the aitools.fyi users in deciding the winner by casting your vote.
Want to flip the script? Upvote your favorite tool and change the game!
WhyHive

What is WhyHive ?
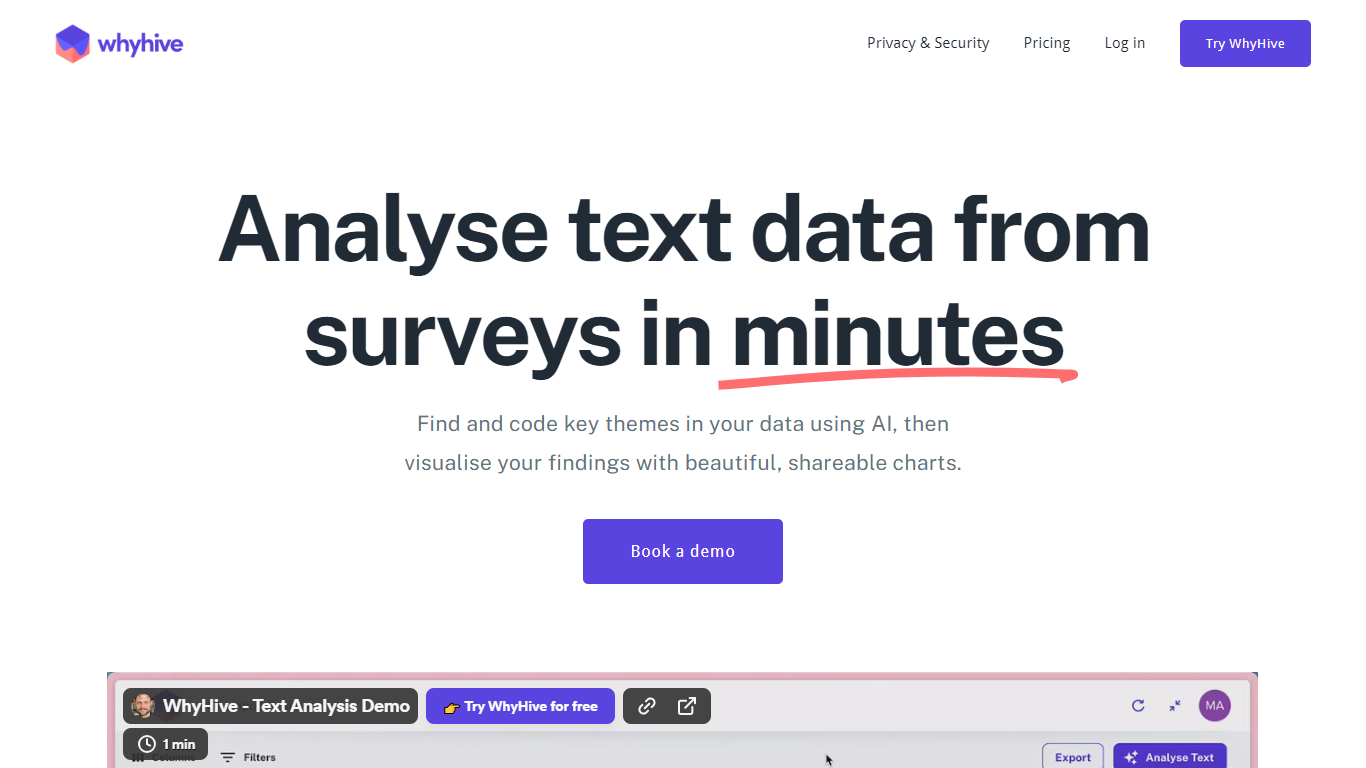
WhyHive is an AI-powered data analysis platform designed to simplify the exploration and visualization of spreadsheet data, including surveys, sales, and customer feedback. It enables users to quickly identify and code key themes in text data, either from scratch or using predefined code-frames, making qualitative and quantitative analysis accessible to non-experts. The tool pairs AI with a rule-based charting engine to provide reliable, hallucination-free insights, ensuring the results are trustworthy and directly drawn from your data.
The platform is built for a wide range of users including researchers, marketers, startups, and impact evaluators, offering an intuitive interface that requires no prior training. Users can upload CSV or Excel files and receive automated data cleaning, theme extraction, and shareable visualizations that help communicate findings effectively across teams and stakeholders.
WhyHive emphasizes data privacy and security, allowing users to choose data storage locations in the US or Australia. Uploaded data is encrypted with AES-256 and is not used to train third-party AI models, ensuring confidentiality. The platform supports collaboration with unlimited project viewers and collaborators, making it suitable for team environments.
The company started as a social enterprise consultancy focused on democratizing data analysis and evolved into a software provider aiming to make data analytics as easy as using Canva. It continues to develop based on user feedback, focusing on text and survey analysis challenges.
WhyHive offers a freemium pricing model with tiered plans that scale in features and text analysis credits, including personalized onboarding and priority support for higher tiers. The platform also provides discounts for nonprofits and grassroots impact projects.
Despite its strengths, WhyHive will shut down on April 28, 2025, as announced on their blog. Until then, it remains a valuable tool for teams seeking to analyze and visualize data quickly and securely.
Vizly
What is Vizly?
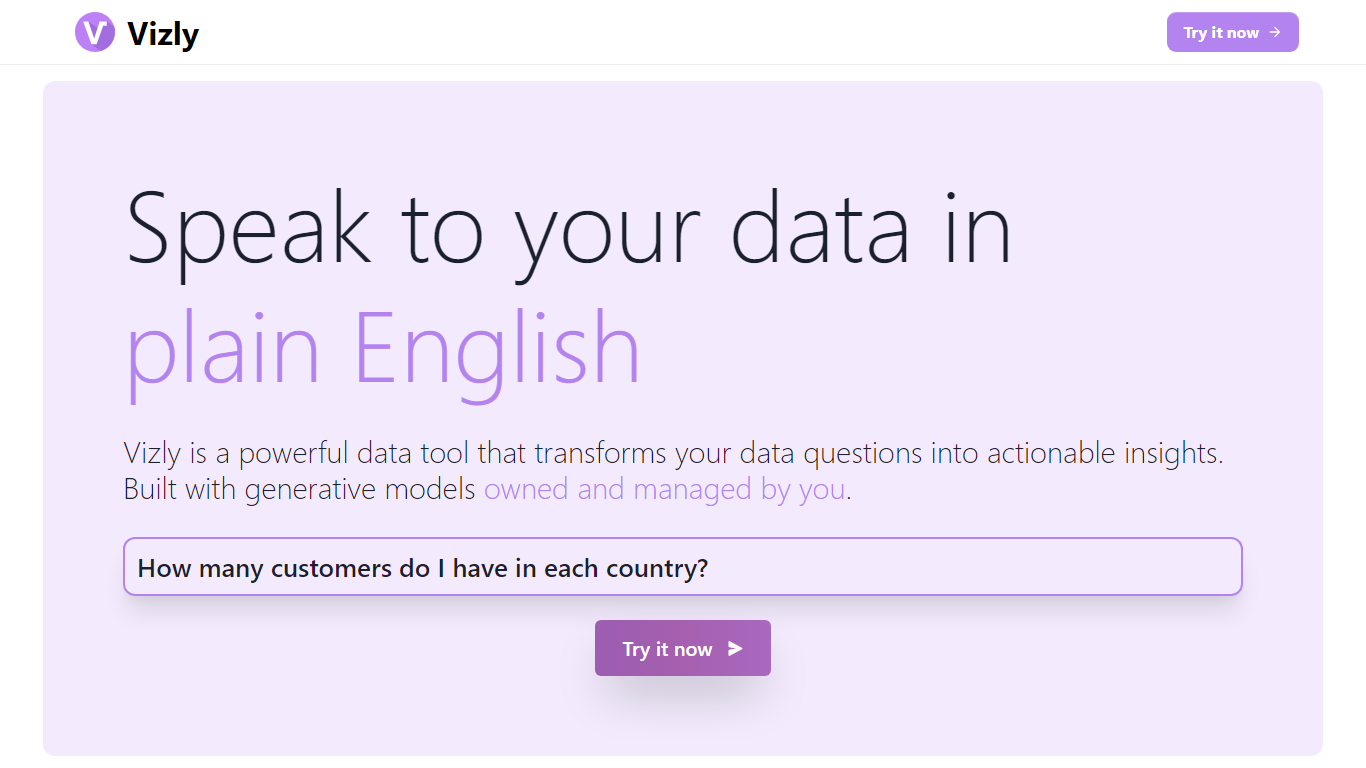
Vizly turns spreadsheet uploads into charts and statistical answers through a chat interface. Upload Excel, CSV, or SPSS files, ask questions in plain language, and get interactive Plotly visualizations, regression lines, and correlation matrices back. A private Python sandbox handles machine learning when you need more than summary stats.
Where Tableau and Looker focus on dashboards you configure by hand, Vizly leans on conversational analysis. You describe what you want to know and the app generates visuals on the fly. The trade-off is less pixel-perfect dashboard control in exchange for faster exploratory analysis.
Vizly suits students, analysts, and researchers in healthcare, finance, and genetics who need quick charts without writing notebook code. Premium adds unlimited messages, persistent files between sessions, and high-performance coding environments for heavier workloads.
WhyHive Upvotes
Vizly Upvotes
WhyHive Top Features
🔍 AI-assisted theme detection identifies key insights from text quickly
📊 Automated chart creation turns data into clear visuals fast
🔒 Data encryption and user-controlled storage location ensure privacy
🤝 Unlimited collaborators and viewers support team-based projects
⚡ Fast processing handles thousands of rows in minutes for big datasets
Vizly Top Features
Chat interface generates Plotly visualizations and statistical analysis from uploaded files
Supports Excel, CSV, and SPSS with built-in data cleaning tools
Private Python code sandbox for machine learning and predictive modeling
Premium plan offers unlimited messages and persistent files between sessions
Use-case templates for healthcare, finance, and genetic research workflows
WhyHive Category
- Data Science
Vizly Category
- Data Science
WhyHive Pricing Type
- Freemium
Vizly Pricing Type
- Freemium