Equals vs Vizly
In the face-off between Equals vs Vizly, which AI Data Science tool takes the crown? We scrutinize features, alternatives, upvotes, reviews, pricing, and more.
When we put Equals and Vizly head to head, which one emerges as the victor?
If we were to analyze Equals and Vizly, both of which are AI-powered data science tools, what would we find? The upvote count is neck and neck for both Equals and Vizly. The power is in your hands! Cast your vote and have a say in deciding the winner.
Disagree with the result? Upvote your favorite tool and help it win!
Equals

What is Equals ?
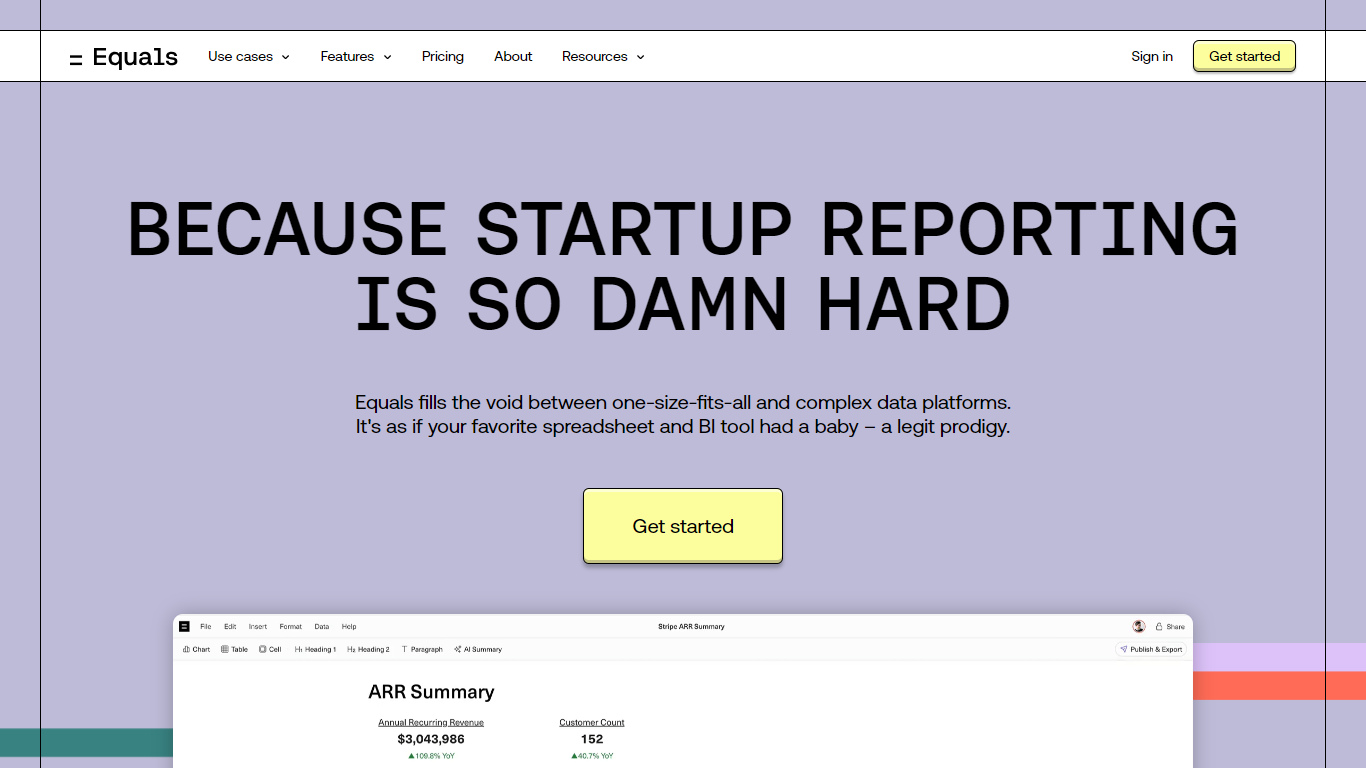
Equals is a platform designed to bring clarity and trust to business data by combining the familiar spreadsheet interface with live data connections and AI-powered insights. It enables teams to build expert workbooks that serve as a single source of truth, ensuring consistent answers across the organization. The platform supports syncing data from multiple sources into a managed warehouse, allowing users to create and maintain dashboards, reports, and models that update automatically. Equals targets revenue operations, finance, and sales teams who need accurate, real-time analytics without the complexity of traditional BI tools. Its AI assistant helps answer questions and build reports, reducing time spent on data wrangling. The platform also supports embedding live charts into collaboration tools like Notion and sending automated updates via Slack or email. With features like writeback to CRMs and enterprise-grade security, Equals integrates deeply into business workflows. It is built to replace error-prone manual reporting with scalable, auditable analytics that teams can trust.
Vizly
What is Vizly?
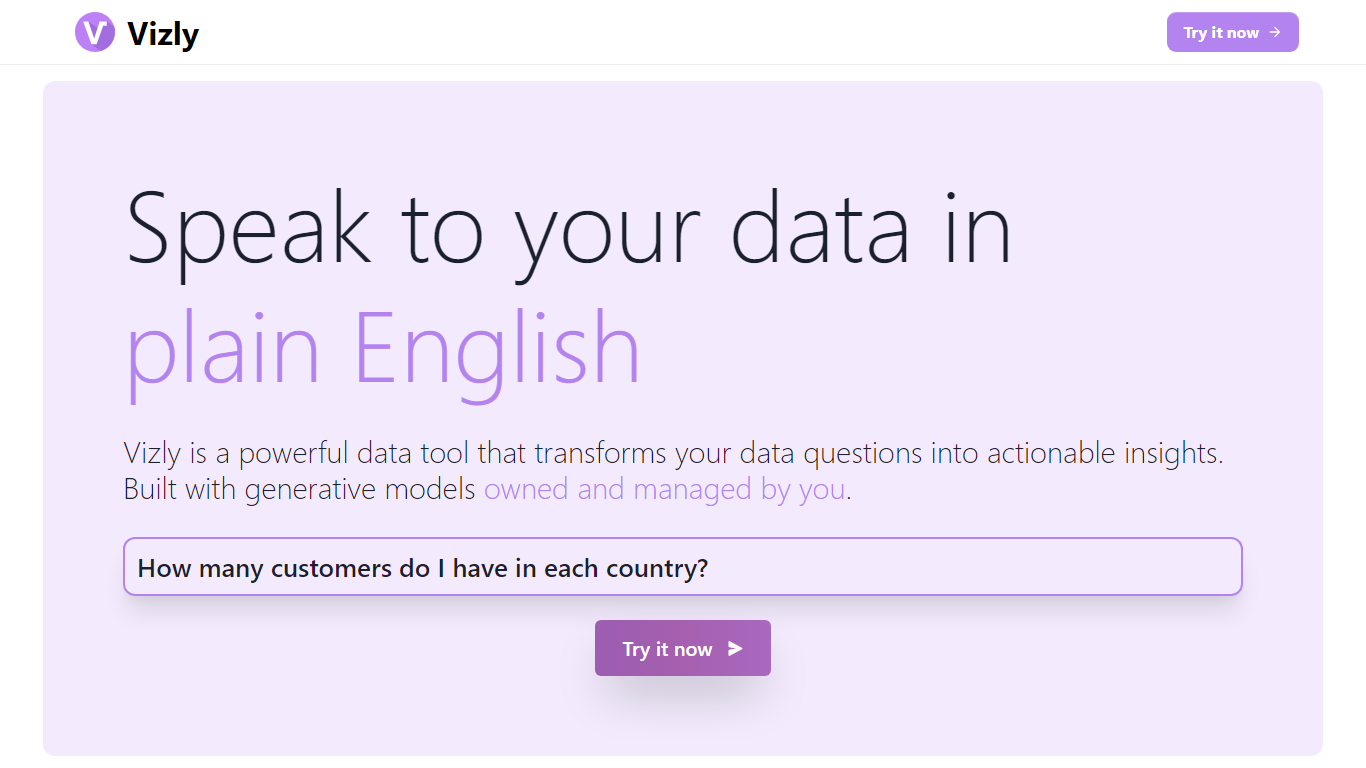
Vizly turns spreadsheet uploads into charts and statistical answers through a chat interface. Upload Excel, CSV, or SPSS files, ask questions in plain language, and get interactive Plotly visualizations, regression lines, and correlation matrices back. A private Python sandbox handles machine learning when you need more than summary stats.
Where Tableau and Looker focus on dashboards you configure by hand, Vizly leans on conversational analysis. You describe what you want to know and the app generates visuals on the fly. The trade-off is less pixel-perfect dashboard control in exchange for faster exploratory analysis.
Vizly suits students, analysts, and researchers in healthcare, finance, and genetics who need quick charts without writing notebook code. Premium adds unlimited messages, persistent files between sessions, and high-performance coding environments for heavier workloads.
Equals Upvotes
Vizly Upvotes
Equals Top Features
📊 Live Data Sync: Connects to multiple data sources and updates automatically, keeping reports current without manual effort.
🤖 AI Assistant: Builds reports and answers business questions instantly, saving time on data analysis and reducing errors.
📈 Custom Dashboards: Create flexible dashboards backed by spreadsheet logic for deep insights into revenue, sales, and customer metrics.
🔄 Writeback Capability: Push calculated data back into CRMs to keep systems aligned and workflows efficient.
🔗 Embeddable Visuals: Embed live charts and tables into tools like Notion or Slack for easy team collaboration and real-time updates.
Vizly Top Features
Chat interface generates Plotly visualizations and statistical analysis from uploaded files
Supports Excel, CSV, and SPSS with built-in data cleaning tools
Private Python code sandbox for machine learning and predictive modeling
Premium plan offers unlimited messages and persistent files between sessions
Use-case templates for healthcare, finance, and genetic research workflows
Equals Category
- Data Science
Vizly Category
- Data Science
Equals Pricing Type
- Paid
Vizly Pricing Type
- Freemium