InstaGraph vs Vizly
In the contest of InstaGraph vs Vizly, which AI Data Science tool is the champion? We evaluate pricing, alternatives, upvotes, features, reviews, and more.
If you had to choose between InstaGraph and Vizly, which one would you go for?
When we examine InstaGraph and Vizly, both of which are AI-enabled data science tools, what unique characteristics do we discover? Both tools are equally favored, as indicated by the identical upvote count. You can help us determine the winner by casting your vote and tipping the scales in favor of one of the tools.
Not your cup of tea? Upvote your preferred tool and stir things up!
InstaGraph

What is InstaGraph?
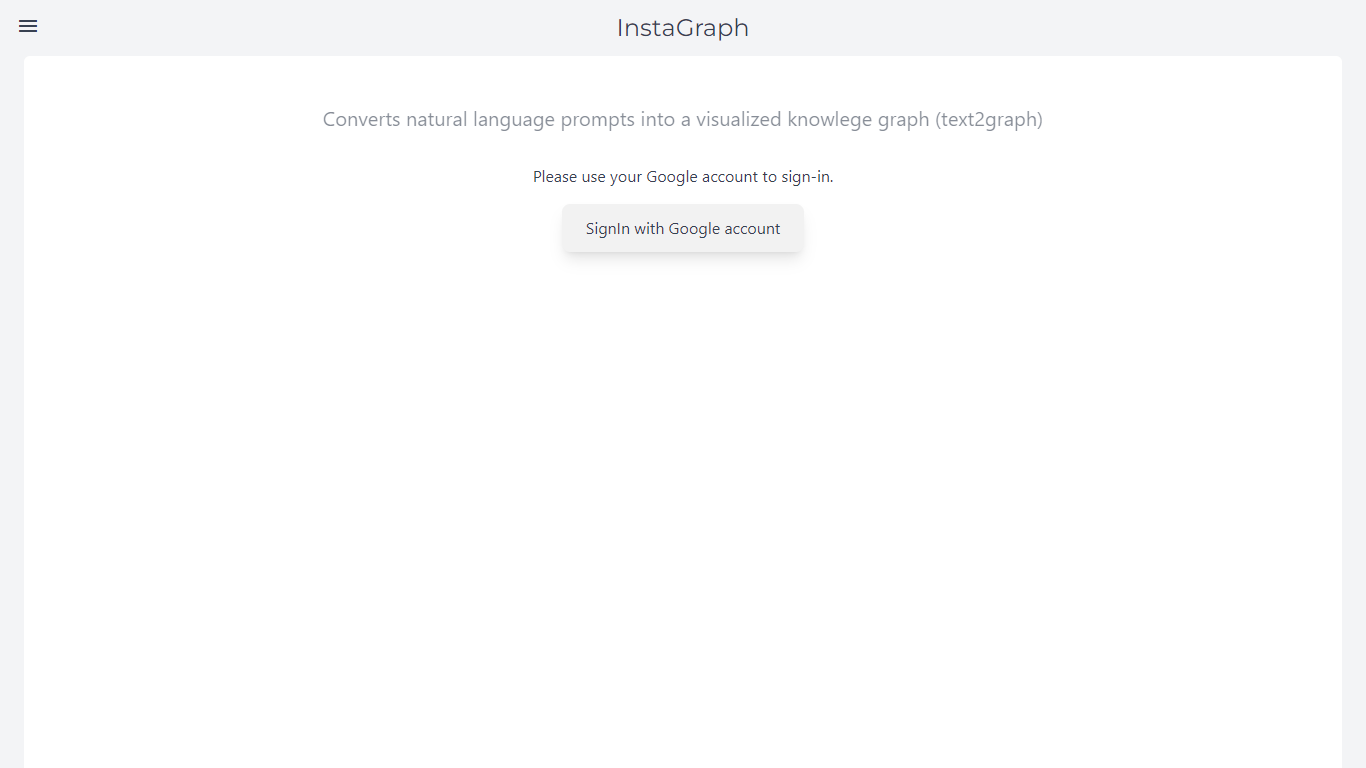
InstaGraph turns text prompts or URLs into interactive knowledge graphs. Type a topic like "Solar System" or paste a link, and the service maps entities and how they connect in a visual graph you can browse and share.
The hosted web app grew out of Yohei Nakajima's open source InstaGraph project, from the same creator behind BabyAGI. GPT generates the nodes and relationships from your input, and finished graphs can appear in a public gallery for others to explore.
Students, researchers, and analysts use it when they want to see how concepts link together instead of reading a wall of text. Google sign-in is required to create graphs.
Vizly
What is Vizly?
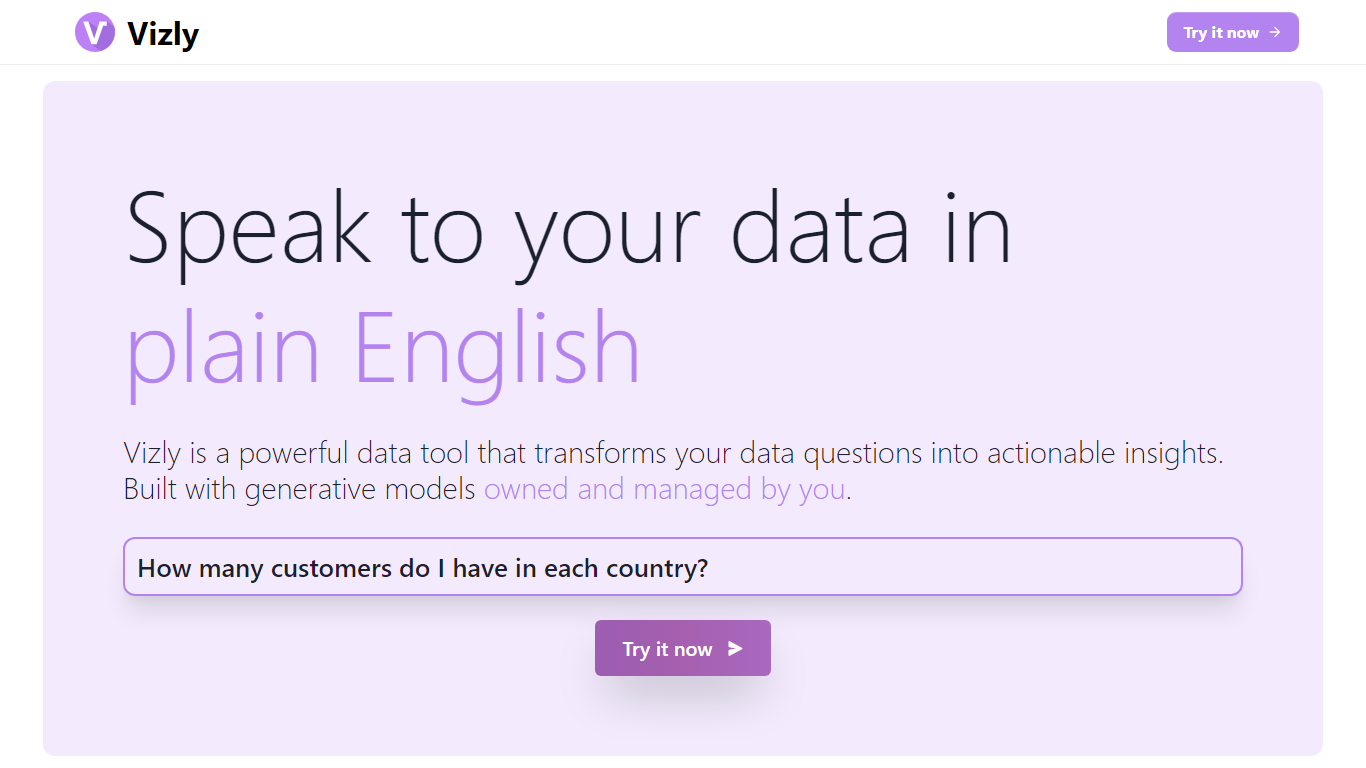
Vizly turns spreadsheet uploads into charts and statistical answers through a chat interface. Upload Excel, CSV, or SPSS files, ask questions in plain language, and get interactive Plotly visualizations, regression lines, and correlation matrices back. A private Python sandbox handles machine learning when you need more than summary stats.
Where Tableau and Looker focus on dashboards you configure by hand, Vizly leans on conversational analysis. You describe what you want to know and the app generates visuals on the fly. The trade-off is less pixel-perfect dashboard control in exchange for faster exploratory analysis.
Vizly suits students, analysts, and researchers in healthcare, finance, and genetics who need quick charts without writing notebook code. Premium adds unlimited messages, persistent files between sessions, and high-performance coding environments for heavier workloads.
InstaGraph Upvotes
Vizly Upvotes
InstaGraph Top Features
Type a natural language prompt and get a full knowledge graph back
Paste a URL and InstaGraph pulls entities into a visual map
Browse community graphs on the public gallery before you sign in
Explore nodes and edges instead of scrolling dense paragraphs
Report bugs or request features through the GitHub support repo
Vizly Top Features
Chat interface generates Plotly visualizations and statistical analysis from uploaded files
Supports Excel, CSV, and SPSS with built-in data cleaning tools
Private Python code sandbox for machine learning and predictive modeling
Premium plan offers unlimited messages and persistent files between sessions
Use-case templates for healthcare, finance, and genetic research workflows
InstaGraph Category
- Data Science
Vizly Category
- Data Science
InstaGraph Pricing Type
- Free
Vizly Pricing Type
- Freemium