Made Live vs Graphy
In the clash of Made Live vs Graphy, which AI Design tool emerges victorious? We assess reviews, pricing, alternatives, features, upvotes, and more.
When we put Made Live and Graphy head to head, which one emerges as the victor?
Let's take a closer look at Made Live and Graphy, both of which are AI-driven design tools, and see what sets them apart. Both tools are equally favored, as indicated by the identical upvote count. Since other aitools.fyi users could decide the winner, the ball is in your court now to cast your vote and help us determine the winner.
Does the result make you go "hmm"? Cast your vote and turn that frown upside down!
Made Live


What is Made Live?
Made Live enables authors and artists to create, publish, and distribute illustrated books such as children's stories, comics, and graphic novels. It provides tools that support the entire publishing process from initial creation to reaching readers.
This tool stands out by focusing specifically on richly illustrated content, offering features tailored to the unique needs of visual storytelling. Unlike general publishing tools, Made Live emphasizes creative control and accessibility for both beginners and experienced creators.
Made Live combines a user-friendly interface with end-to-end publishing solutions, allowing users to maintain ownership of their work while simplifying distribution. This approach helps creators share their illustrated stories with a broad audience without sacrificing artistic vision.
Graphy
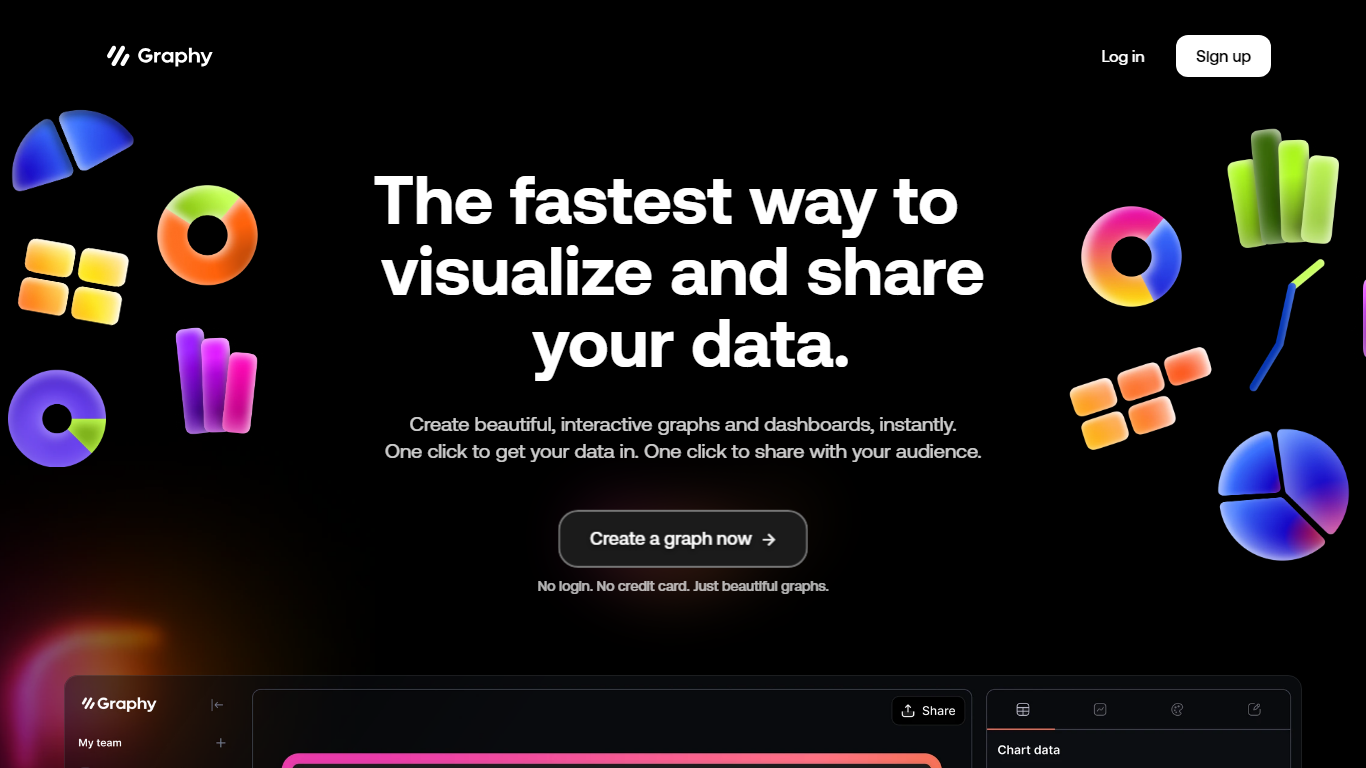
What is Graphy?
Graphy is an online chart and graph maker that turns raw data into branded, shareable visuals. You can link a Google Sheet, upload CSV or Excel files, paste values, call the Chart API, or ask AI to find data, then get interactive bar, line, pie, funnel, and heatmap charts without spreadsheet formatting.
Unlike static screenshot tools or rigid BI dashboards, Graphy pairs an AI data engine with editable charts you can annotate, brand, and export to slides, social posts, or embedded docs. The free plan caps you at 5 charts with limited AI, while paid tiers remove the watermark and add unlimited charts plus Google Sheets auto-refresh on Business.
Graphy fits marketers building campaign reports, founders sharing board metrics, and analysts who need polished visuals fast instead of default spreadsheet charts. The same company also ships a React chart library and enterprise SDK at graphy.dev for teams embedding charts inside their own products.
Made Live Upvotes
Graphy Upvotes
Made Live Top Features
📚 End-to-End Publishing: Manage creation, publishing, and distribution in one platform.
🎨 Illustration-Focused Tools: Designed specifically for children's books, comics, and graphic novels.
🖥️ User-Friendly Interface: Accessible to both beginners and experienced creators.
🌍 Broad Distribution: Features to help reach a wide audience effectively.
🔒 Full Creative Control: Maintain ownership and control over your published work.
📄 Supports Multiple Formats: Publish in formats suitable for illustrated content.
💡 Streamlined Workflow: Simplifies the publishing process from start to finish.
Graphy Top Features
Imports Google Sheets, CSV, Excel, pasted values, or API data without manual formatting
AI engine highlights insights and suggests chart types from your dataset
Supports bar, line, pie, funnel, heatmap, and 20+ other chart templates
Free plan includes 5 charts; Plus at $16 per user per month removes limits
Business plan at $36 per user per month adds auto Google Sheets refresh and password-protected links
Made Live Category
- Design
Graphy Category
- Design
Made Live Pricing Type
- Freemium
Graphy Pricing Type
- Freemium