
Last updated 08-15-2026
Category:
Reviews:
Join thousands of AI enthusiasts in the World of AI!
Graphy
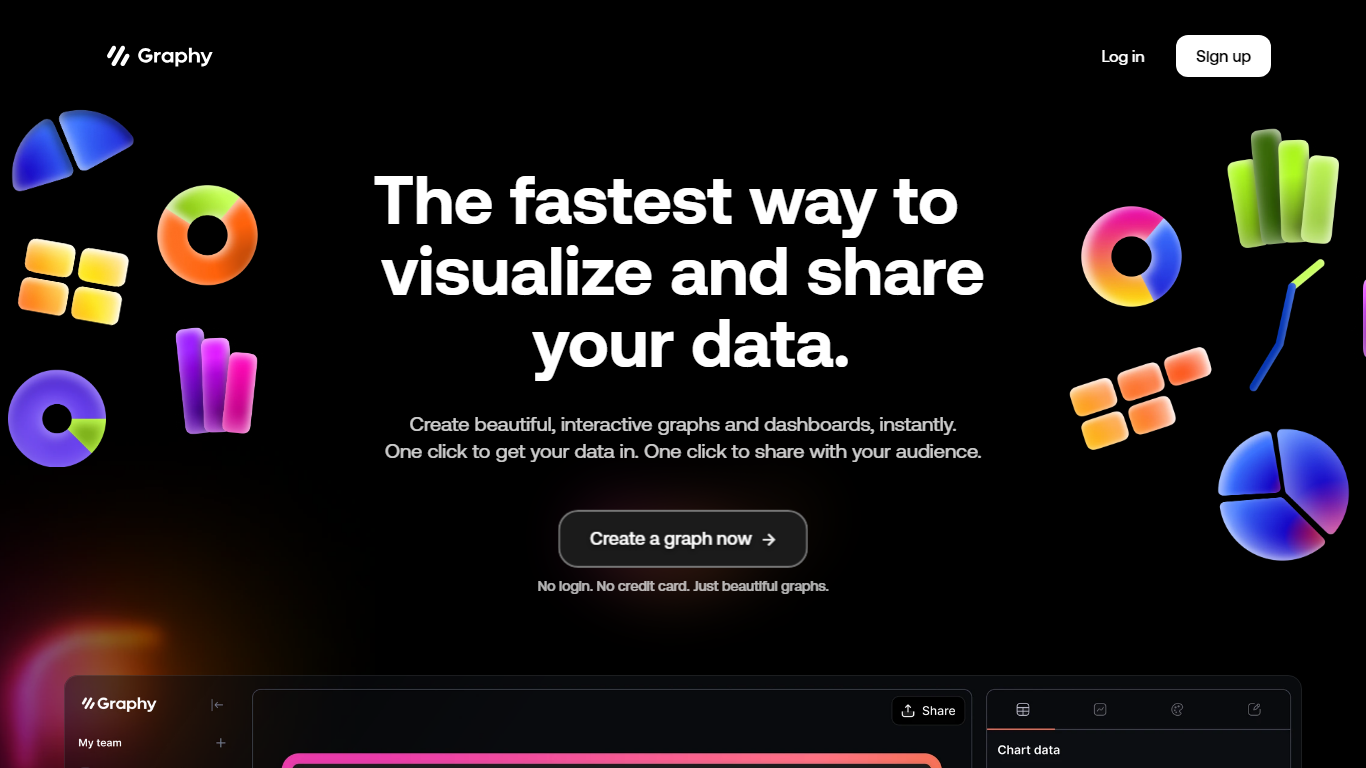
Graphy is an online chart and graph maker that turns raw data into branded, shareable visuals. You can link a Google Sheet, upload CSV or Excel files, paste values, call the Chart API, or ask AI to find data, then get interactive bar, line, pie, funnel, and heatmap charts without spreadsheet formatting.
Unlike static screenshot tools or rigid BI dashboards, Graphy pairs an AI data engine with editable charts you can annotate, brand, and export to slides, social posts, or embedded docs. The free plan caps you at 5 charts with limited AI, while paid tiers remove the watermark and add unlimited charts plus Google Sheets auto-refresh on Business.
Graphy fits marketers building campaign reports, founders sharing board metrics, and analysts who need polished visuals fast instead of default spreadsheet charts. The same company also ships a React chart library and enterprise SDK at graphy.dev for teams embedding charts inside their own products.
Imports Google Sheets, CSV, Excel, pasted values, or API data without manual formatting
AI engine highlights insights and suggests chart types from your dataset
Supports bar, line, pie, funnel, heatmap, and 20+ other chart templates
Free plan includes 5 charts; Plus at $16 per user per month removes limits
Business plan at $36 per user per month adds auto Google Sheets refresh and password-protected links
Creates polished charts from Google Sheets, CSV, or Excel without manual formatting
AI suggests insights and chart types while showing how it reached each conclusion
Free tier lets you test with 5 charts before upgrading
Wide chart library covers funnels, heatmaps, Likert scales, and combo charts
Trusted by 300,000+ users including teams at Lattice and Product Hunt
Free plan limited to 5 charts with Graphy watermark on exports
Business tier at $36 per user per month needed for Google Sheets auto-refresh
Enterprise SDK and React library live on a separate graphy.dev site
Is Graphy free to use?
Yes, Graphy offers a free plan with 5 charts and limited AI features. Graphy lets you share charts anywhere, but free exports include the Graphy watermark unless you upgrade to Plus or Business.
What data sources does Graphy support?
Graphy accepts live Google Sheets links, CSV and Excel uploads, pasted values, and API calls. Graphy ingests data without requiring you to pre-format spreadsheets, and the Business plan adds automatic Google Sheets refresh.
How much does Graphy Plus cost?
Graphy Plus costs $16 per user per month on an annual plan. Graphy Plus includes unlimited charts, unlimited AI features, custom colors, and removes the Graphy logo from shared charts.
Can I embed Graphy charts in other tools?
Yes, Graphy charts can be embedded into documents, slides, and other platforms. Graphy also offers export options for social posts and presentations, and the Business plan adds password-protected sharing links.
What chart types does Graphy support?
Graphy supports bar, line, pie, funnel, heatmap, stacked bar, donut, time series, Likert scale, and combo charts among others. Graphy lists more than 20 chart templates on its graphs directory page.
Does Graphy have a developer API?
Yes, Graphy offers a Chart API and React charting library documented at graphy.dev. Graphy lets developers drop production-ready charts into React apps with a single typed config object.