Befront vs Graphy
Compare Befront vs Graphy and see which AI Design tool is better when we compare features, reviews, pricing, alternatives, upvotes, etc.
Which one is better? Befront or Graphy?
When we compare Befront with Graphy, which are both AI-powered design tools, The upvote count reveals a draw, with both tools earning the same number of upvotes. Be a part of the decision-making process. Your vote could determine the winner.
Disagree with the result? Upvote your favorite tool and help it win!
Befront

What is Befront?
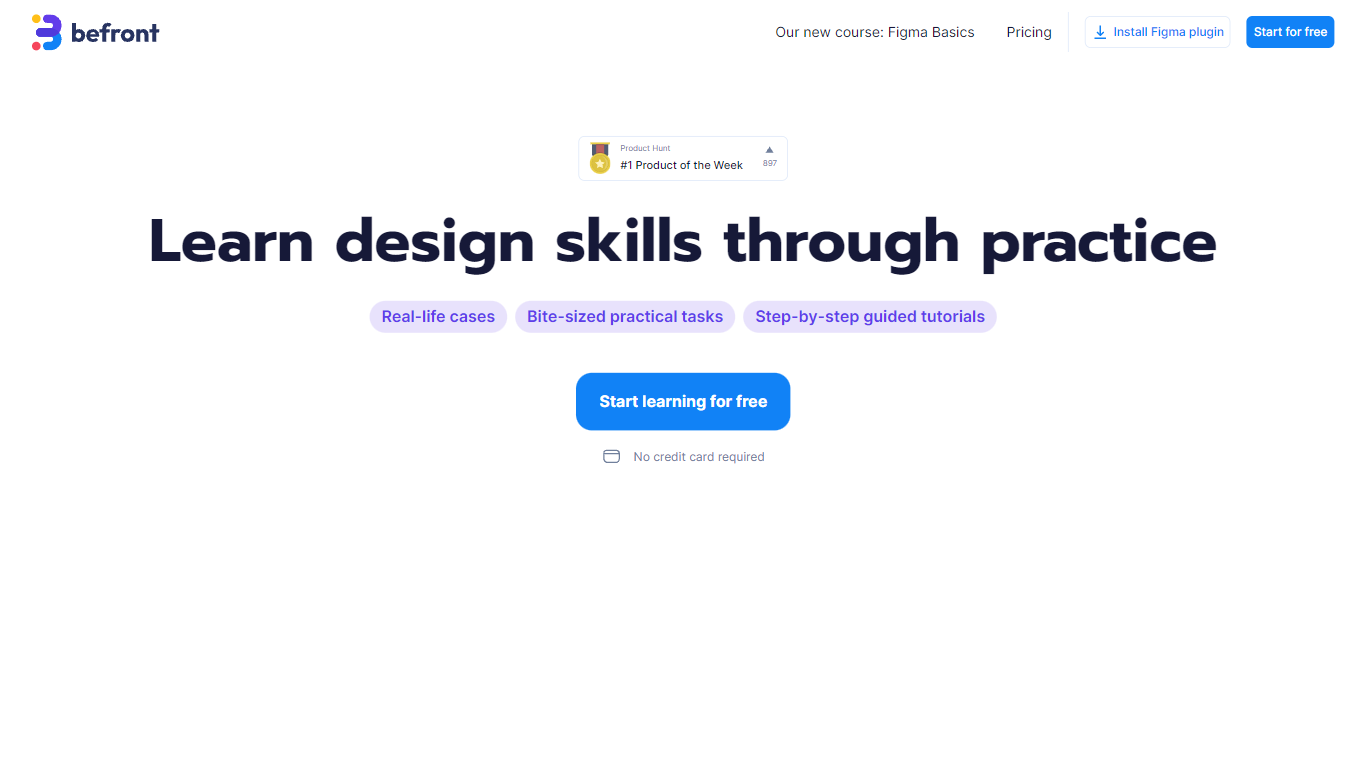
Befront is a Figma Community plugin that works as a hands-on design trainer. You install it in Figma, pick a skill to train, and complete short UI tasks on real interfaces with instant feedback as you work. It focuses on practical layout and component work rather than passive theory.
Most design courses lean on video lectures that are easy to watch and hard to retain. Befront runs short drills you can finish in about five minutes, with topic picks like Auto Layout and components instead of a fixed syllabus. That makes it closer to a daily gym routine than a semester-long course.
The homepage positions Befront for designers who feel stuck in Figma, working designers who want more speed, and career switchers learning UX/UI from scratch. Developers, product managers, founders, and marketers who need to work confidently in Figma are also called out in the FAQ.
You track progress over time, compete with other designers, and can try design mini-games for quick interactive practice. A free trial offers access to trial lessons, while paid plans start at $11 per week or $30 per month for full access.
Graphy
What is Graphy?
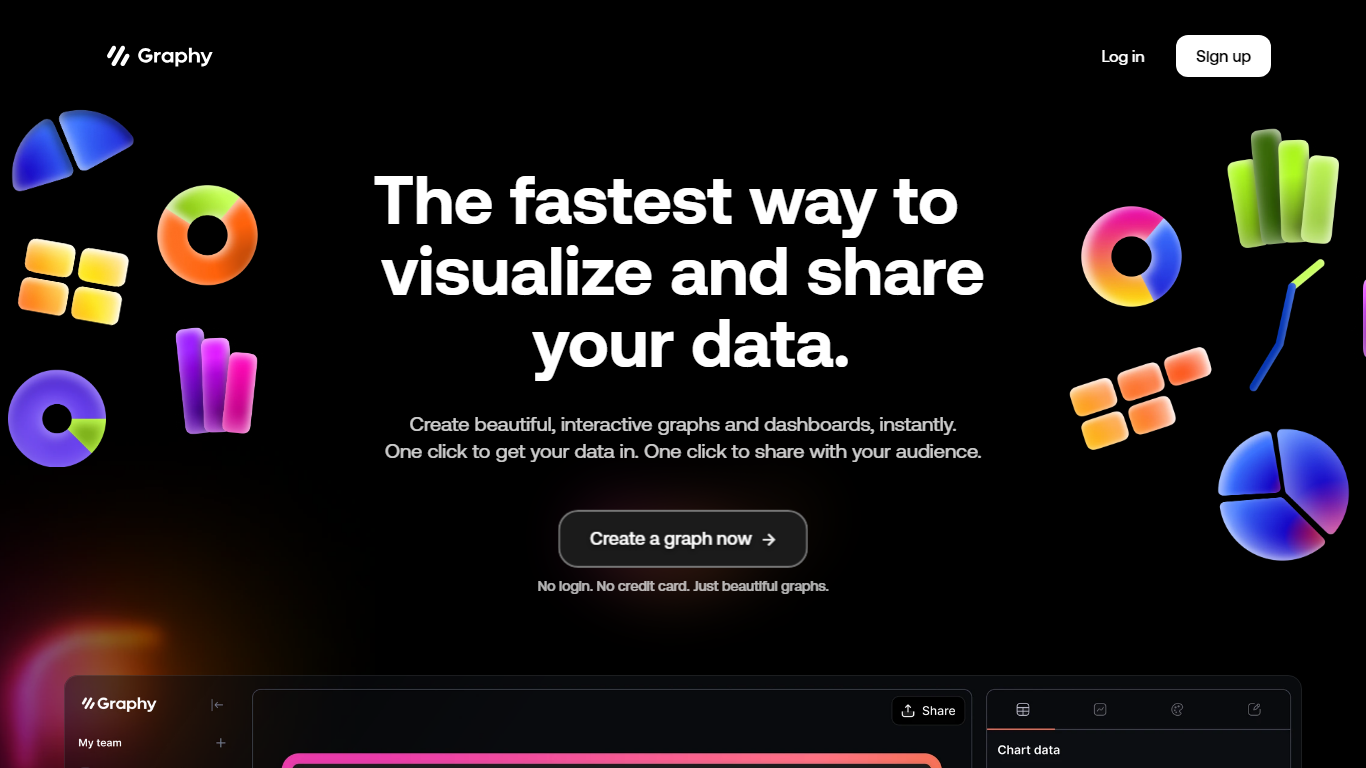
Graphy is an online chart and graph maker that turns raw data into branded, shareable visuals. You can link a Google Sheet, upload CSV or Excel files, paste values, call the Chart API, or ask AI to find data, then get interactive bar, line, pie, funnel, and heatmap charts without spreadsheet formatting.
Unlike static screenshot tools or rigid BI dashboards, Graphy pairs an AI data engine with editable charts you can annotate, brand, and export to slides, social posts, or embedded docs. The free plan caps you at 5 charts with limited AI, while paid tiers remove the watermark and add unlimited charts plus Google Sheets auto-refresh on Business.
Graphy fits marketers building campaign reports, founders sharing board metrics, and analysts who need polished visuals fast instead of default spreadsheet charts. The same company also ships a React chart library and enterprise SDK at graphy.dev for teams embedding charts inside their own products.
Befront Upvotes
Graphy Upvotes
Befront Top Features
Daily drills you can finish in about five minutes with instant feedback inside Figma
Monthly plan at $30 per month or Weekly plan at $11 per week for full access to all content
Topic-specific training for Auto Layout, components, and other job-ready Figma skills
Design mini-games for quick interactive practice on real interfaces
Free Trial at $0 with access to trial lessons inside the Figma plugin
Graphy Top Features
Imports Google Sheets, CSV, Excel, pasted values, or API data without manual formatting
AI engine highlights insights and suggests chart types from your dataset
Supports bar, line, pie, funnel, heatmap, and 20+ other chart templates
Free plan includes 5 charts; Plus at $16 per user per month removes limits
Business plan at $36 per user per month adds auto Google Sheets refresh and password-protected links
Befront Category
- Design
Graphy Category
- Design
Befront Pricing Type
- Freemium
Graphy Pricing Type
- Freemium