Onvo AI vs Vizly
In the face-off between Onvo AI vs Vizly, which AI Data Science tool takes the crown? We scrutinize features, alternatives, upvotes, reviews, pricing, and more.
In a face-off between Onvo AI and Vizly, which one takes the crown?
If we were to analyze Onvo AI and Vizly, both of which are AI-powered data science tools, what would we find? Both tools are equally favored, as indicated by the identical upvote count. Since other aitools.fyi users could decide the winner, the ball is in your court now to cast your vote and help us determine the winner.
You don't agree with the result? Cast your vote to help us decide!
Onvo AI

What is Onvo AI ?
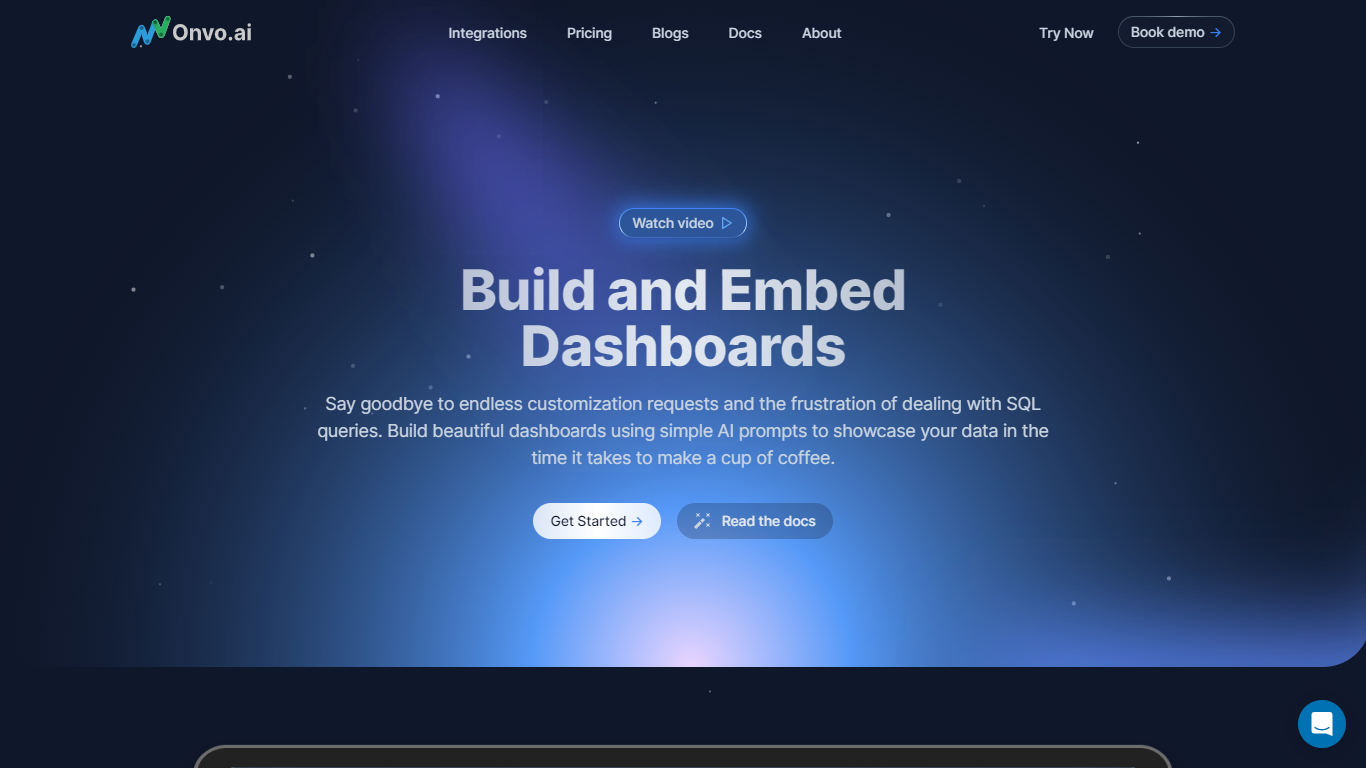
Onvo AI simplifies data visualization by connecting your databases and spreadsheets to create live, shareable dashboards instantly. It automatically cleans messy data like merged cells and inconsistent dates, so your charts always show accurate numbers without manual fixes. The platform understands relationships between tables and applies your brand's colors and terminology consistently across all visuals. You can ask questions in plain English and get clear answers with supporting charts, making data exploration accessible without SQL knowledge. Onvo AI supports embedding dashboards into your products with per-user data isolation and customizable styling, enabling you to share insights securely with clients or teams. Scheduled reports and anomaly alerts keep you informed automatically, while multiple tabs and metadata features help organize and filter your dashboards effectively. With integrations to over 500 systems and support for various data sources, Onvo AI is designed for fast setup and scalable use across industries.
Vizly
What is Vizly?
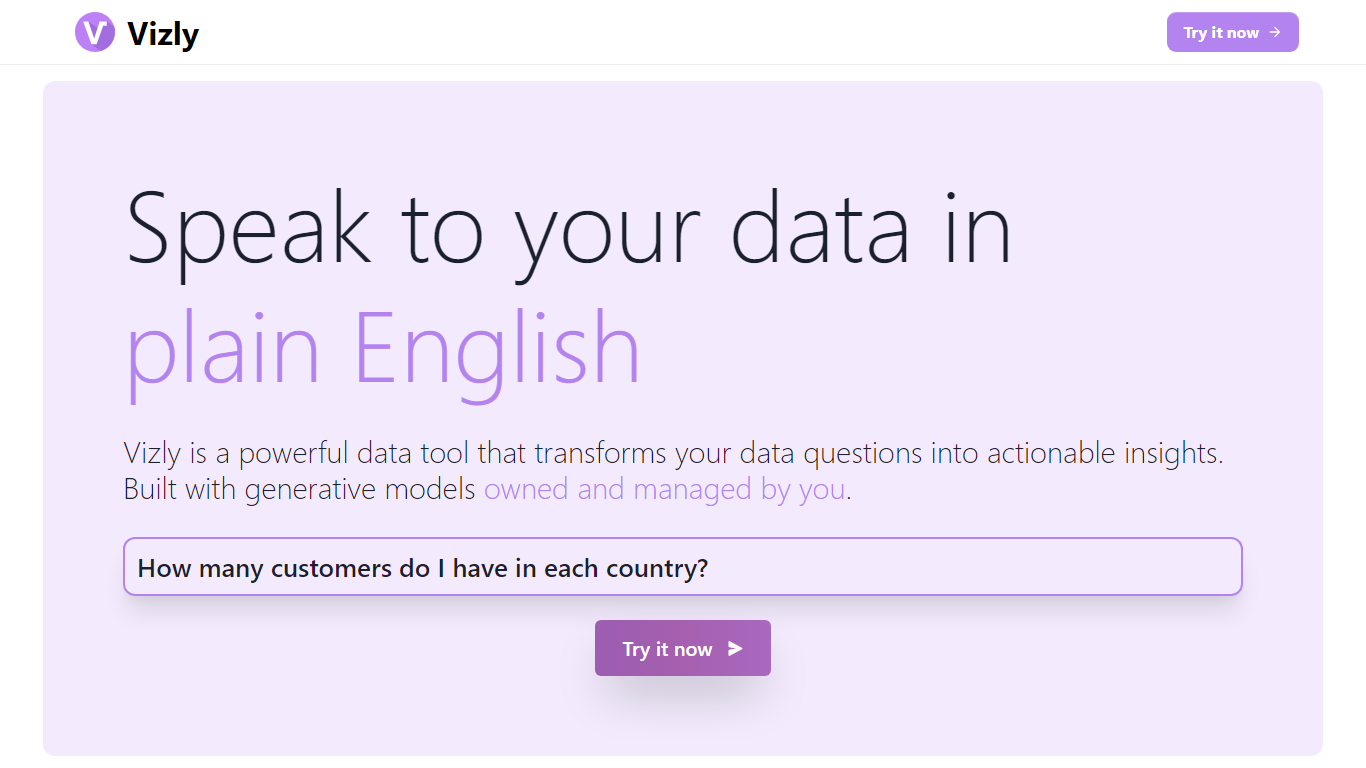
Vizly turns spreadsheet uploads into charts and statistical answers through a chat interface. Upload Excel, CSV, or SPSS files, ask questions in plain language, and get interactive Plotly visualizations, regression lines, and correlation matrices back. A private Python sandbox handles machine learning when you need more than summary stats.
Where Tableau and Looker focus on dashboards you configure by hand, Vizly leans on conversational analysis. You describe what you want to know and the app generates visuals on the fly. The trade-off is less pixel-perfect dashboard control in exchange for faster exploratory analysis.
Vizly suits students, analysts, and researchers in healthcare, finance, and genetics who need quick charts without writing notebook code. Premium adds unlimited messages, persistent files between sessions, and high-performance coding environments for heavier workloads.
Onvo AI Upvotes
Vizly Upvotes
Onvo AI Top Features
🔗 Connect any data source quickly including databases and spreadsheets
🧹 Automatic data cleaning fixes errors and inconsistencies for accurate charts
💬 Ask questions in plain English and get instant visual answers
📊 Embed live, branded dashboards with per-user data isolation
📅 Schedule reports and receive alerts on key metric changes
Vizly Top Features
Chat interface generates Plotly visualizations and statistical analysis from uploaded files
Supports Excel, CSV, and SPSS with built-in data cleaning tools
Private Python code sandbox for machine learning and predictive modeling
Premium plan offers unlimited messages and persistent files between sessions
Use-case templates for healthcare, finance, and genetic research workflows
Onvo AI Category
- Data Science
Vizly Category
- Data Science
Onvo AI Pricing Type
- Paid
Vizly Pricing Type
- Freemium