Satlas vs Vizly
In the contest of Satlas vs Vizly, which AI Data Science tool is the champion? We evaluate pricing, alternatives, upvotes, features, reviews, and more.
If you had to choose between Satlas and Vizly, which one would you go for?
When we examine Satlas and Vizly, both of which are AI-enabled data science tools, what unique characteristics do we discover? The upvote count reveals a draw, with both tools earning the same number of upvotes. Join the aitools.fyi users in deciding the winner by casting your vote.
Feeling rebellious? Cast your vote and shake things up!
Satlas

What is Satlas?
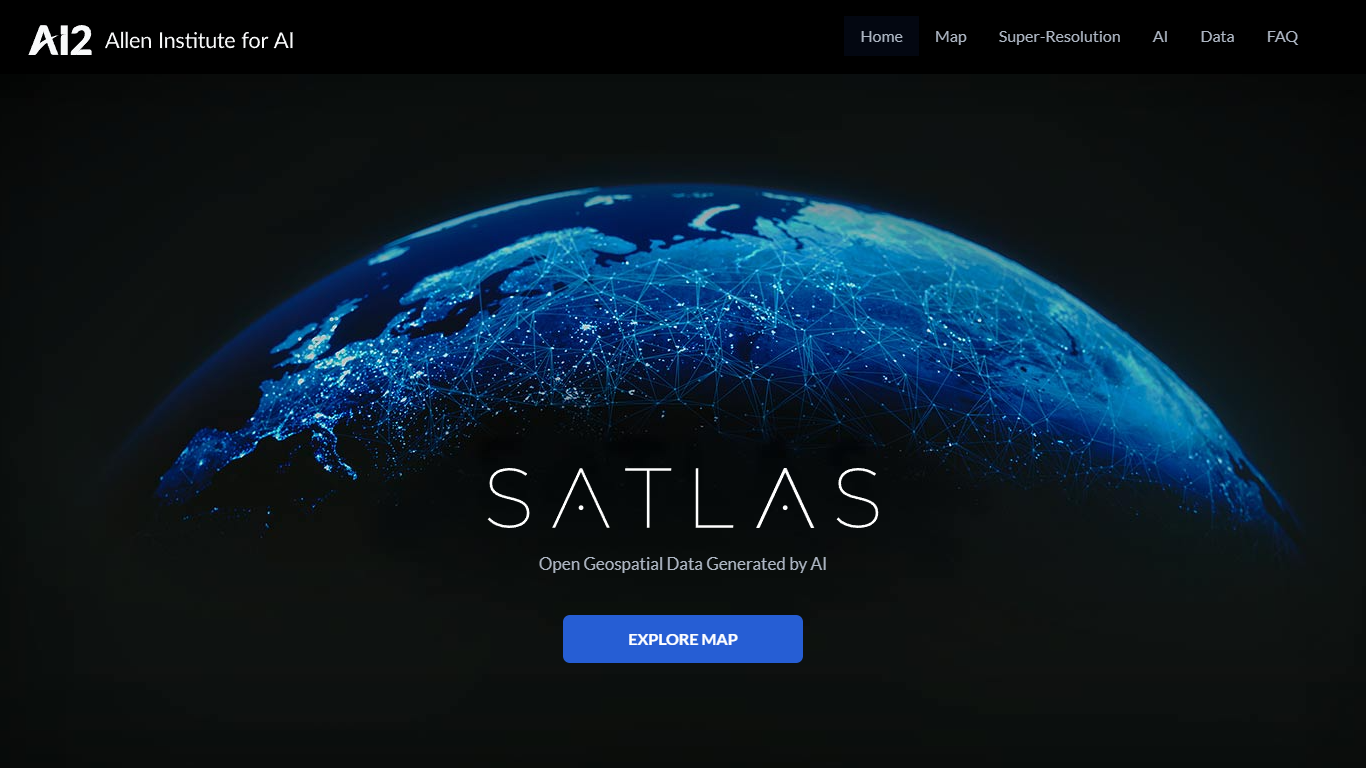
Satlas is an open geospatial platform from the Allen Institute for AI (Ai2) that uses computer vision models to analyze public Sentinel-2 satellite imagery and produce global, monthly-updated datasets. It lets researchers, environmental scientists, and geospatial analysts explore how the planet is changing through an interactive map covering marine infrastructure, renewable energy infrastructure, and tree cover.
The platform processes freely available satellite images with AI models pre-trained on SatlasPretrain, a remote sensing dataset with over 30 TB of imagery and 302 million labels. Users can compare side-by-side or timelapse views of offshore wind farms, solar installations, deforestation, and other land-use changes dating back to January 2016.
All geospatial data products, model weights, and training labels are freely downloadable under the ODC-BY license. Satlas also includes a super-resolution module that enhances low-resolution Sentinel-2 imagery to produce higher-detail global views, with open-source code available on GitHub.
Vizly
What is Vizly?
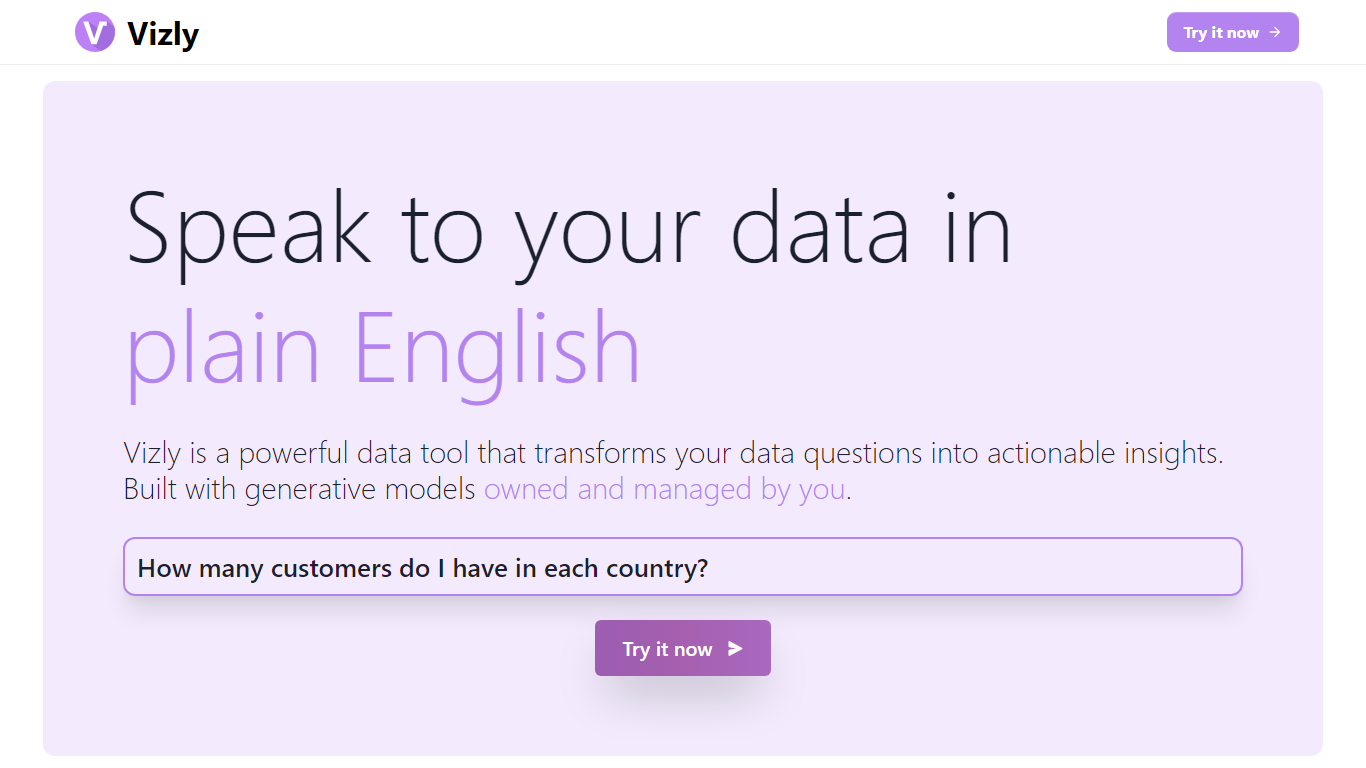
Vizly turns spreadsheet uploads into charts and statistical answers through a chat interface. Upload Excel, CSV, or SPSS files, ask questions in plain language, and get interactive Plotly visualizations, regression lines, and correlation matrices back. A private Python sandbox handles machine learning when you need more than summary stats.
Where Tableau and Looker focus on dashboards you configure by hand, Vizly leans on conversational analysis. You describe what you want to know and the app generates visuals on the fly. The trade-off is less pixel-perfect dashboard control in exchange for faster exploratory analysis.
Vizly suits students, analysts, and researchers in healthcare, finance, and genetics who need quick charts without writing notebook code. Premium adds unlimited messages, persistent files between sessions, and high-performance coding environments for heavier workloads.
Satlas Upvotes
Vizly Upvotes
Satlas Top Features
Interactive map with side-by-side and timelapse views of global environmental change since 2016
Monthly AI-generated datasets for marine infrastructure, renewable energy, and tree cover
Super-resolution module that enhances Sentinel-2 imagery to higher detail on a global scale
Freely downloadable GeoJSON and GeoTIFF data products under the ODC-BY open license
Open-source model weights, training data, and inference code on GitHub
Vizly Top Features
Chat interface generates Plotly visualizations and statistical analysis from uploaded files
Supports Excel, CSV, and SPSS with built-in data cleaning tools
Private Python code sandbox for machine learning and predictive modeling
Premium plan offers unlimited messages and persistent files between sessions
Use-case templates for healthcare, finance, and genetic research workflows
Satlas Category
- Data Science
Vizly Category
- Data Science
Satlas Pricing Type
- Free
Vizly Pricing Type
- Freemium