Vizly vs Censius
Dive into the comparison of Vizly vs Censius and discover which AI Data Science tool stands out. We examine alternatives, upvotes, features, reviews, pricing, and beyond.
When comparing Vizly and Censius, which one rises above the other?
When we compare Vizly and Censius, two exceptional data science tools powered by artificial intelligence, and place them side by side, several key similarities and differences come to light. There's no clear winner in terms of upvotes, as both tools have received the same number. You can help us determine the winner by casting your vote and tipping the scales in favor of one of the tools.
Don't agree with the result? Cast your vote and be a part of the decision-making process!
Vizly
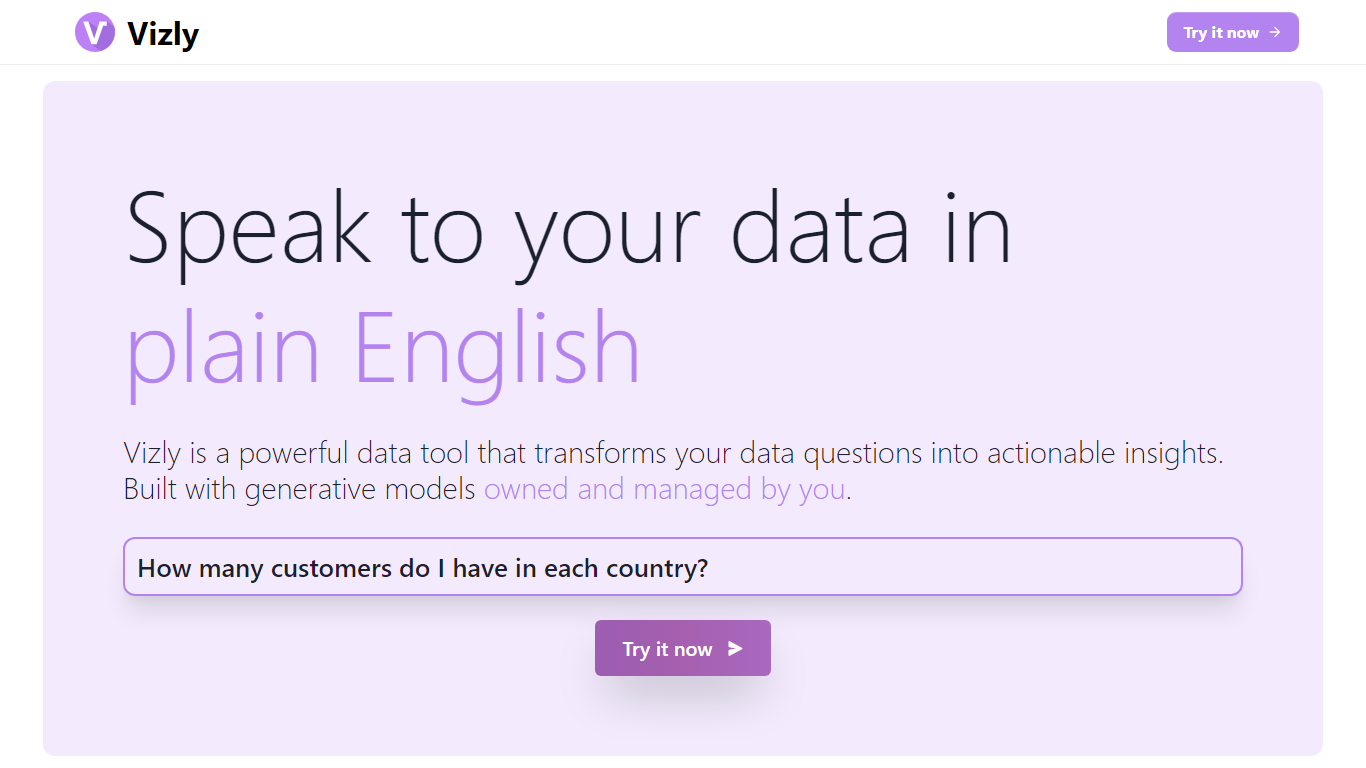

What is Vizly?
Vizly turns spreadsheet uploads into charts and statistical answers through a chat interface. Upload Excel, CSV, or SPSS files, ask questions in plain language, and get interactive Plotly visualizations, regression lines, and correlation matrices back. A private Python sandbox handles machine learning when you need more than summary stats.
Where Tableau and Looker focus on dashboards you configure by hand, Vizly leans on conversational analysis. You describe what you want to know and the app generates visuals on the fly. The trade-off is less pixel-perfect dashboard control in exchange for faster exploratory analysis.
Vizly suits students, analysts, and researchers in healthcare, finance, and genetics who need quick charts without writing notebook code. Premium adds unlimited messages, persistent files between sessions, and high-performance coding environments for heavier workloads.
Censius
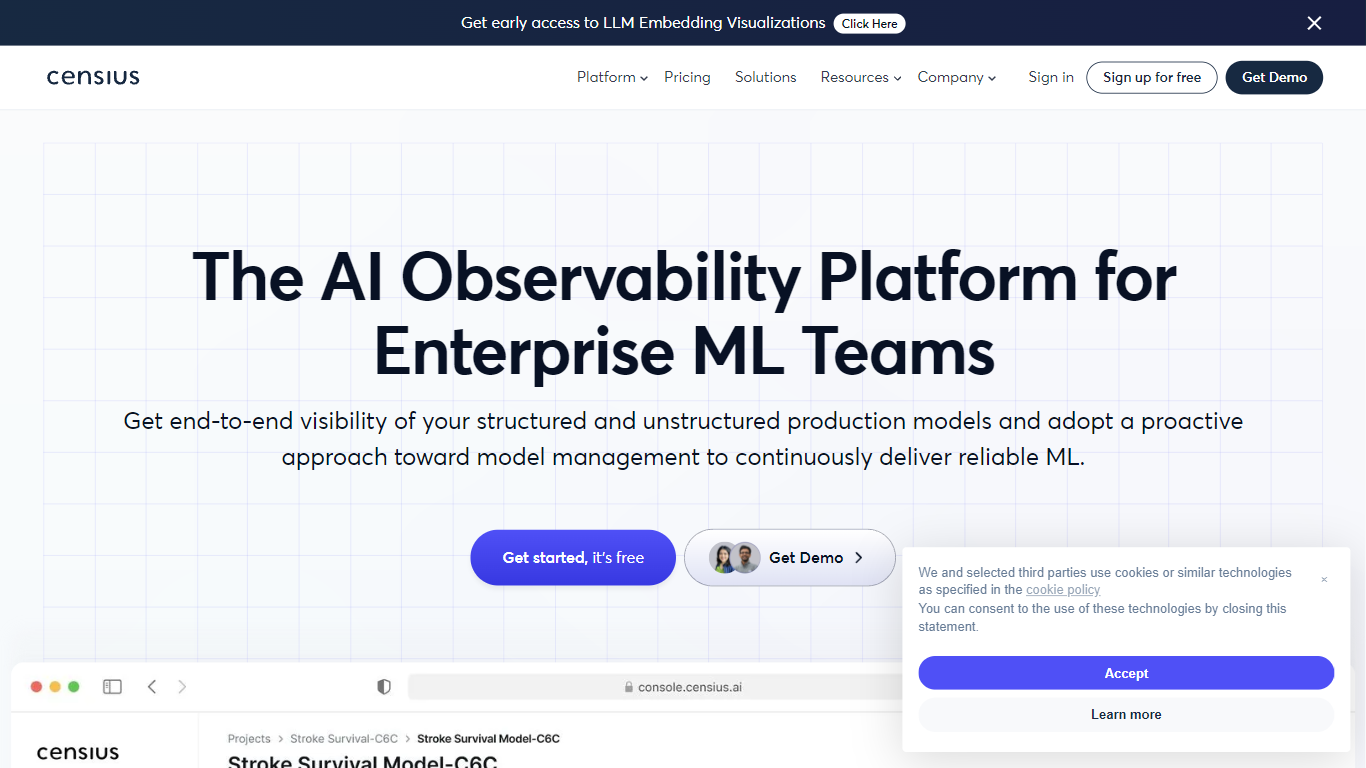
What is Censius?
Censius gives ML teams a single console to watch production models after deployment. You register datasets and models, stream predictions through a Python SDK or REST API, and Censius auto-builds monitors for performance, drift, data quality, and activity volume. Violations surface in dashboards with paths into root cause analysis instead of manual log digging.
Where many monitoring tools stop at accuracy charts, Censius ties monitoring to explainability. SHAP values show which features pushed each prediction, and guided workflows connect monitor alerts to the segments or model versions that triggered them. The platform also supports custom business metrics alongside standard scores like F1, sensitivity, and specificity.
Integration stays practical for enterprise stacks. Projects group models by client or use case, datasets register from CSV uploads, and bulk_log() batches daily prediction logs. Auto-initialized monitors can take 30 to 60 minutes after training data upload depending on feature count and dataset size. Logs aggregate every 60 minutes by default, with custom deployment frequencies available on request.
Data scientists use Censius to visualize assumptions in live models, while ML engineers catch pipeline bugs before users feel them. Business stakeholders get shareable dashboards for model health without reading raw telemetry. Access starts through the web console at console.censius.ai or by requesting a tenant via the signup flow.
Vizly Upvotes
Censius Upvotes
Vizly Top Features
Chat interface generates Plotly visualizations and statistical analysis from uploaded files
Supports Excel, CSV, and SPSS with built-in data cleaning tools
Private Python code sandbox for machine learning and predictive modeling
Premium plan offers unlimited messages and persistent files between sessions
Use-case templates for healthcare, finance, and genetic research workflows
Censius Top Features
Four monitor families cover performance, drift, data quality, and prediction volume
Python SDK installs via pip install censius with REST API and Java SDK options
SHAP explainability shows per-feature contribution to individual predictions
Auto-initialized monitors build from uploaded training data in 30 to 60 minutes
bulk_log() sends predictions, actuals, and explanations in one daily batch call
Unlimited models and model versions under configurable performance and drift monitors
Production logs aggregate every 60 minutes by default across deployed models
Vizly Category
- Data Science
Censius Category
- Data Science
Vizly Pricing Type
- Freemium
Censius Pricing Type
- Freemium