
Last updated 08-09-2026
Category:
Reviews:
Join thousands of AI enthusiasts in the World of AI!
Censius
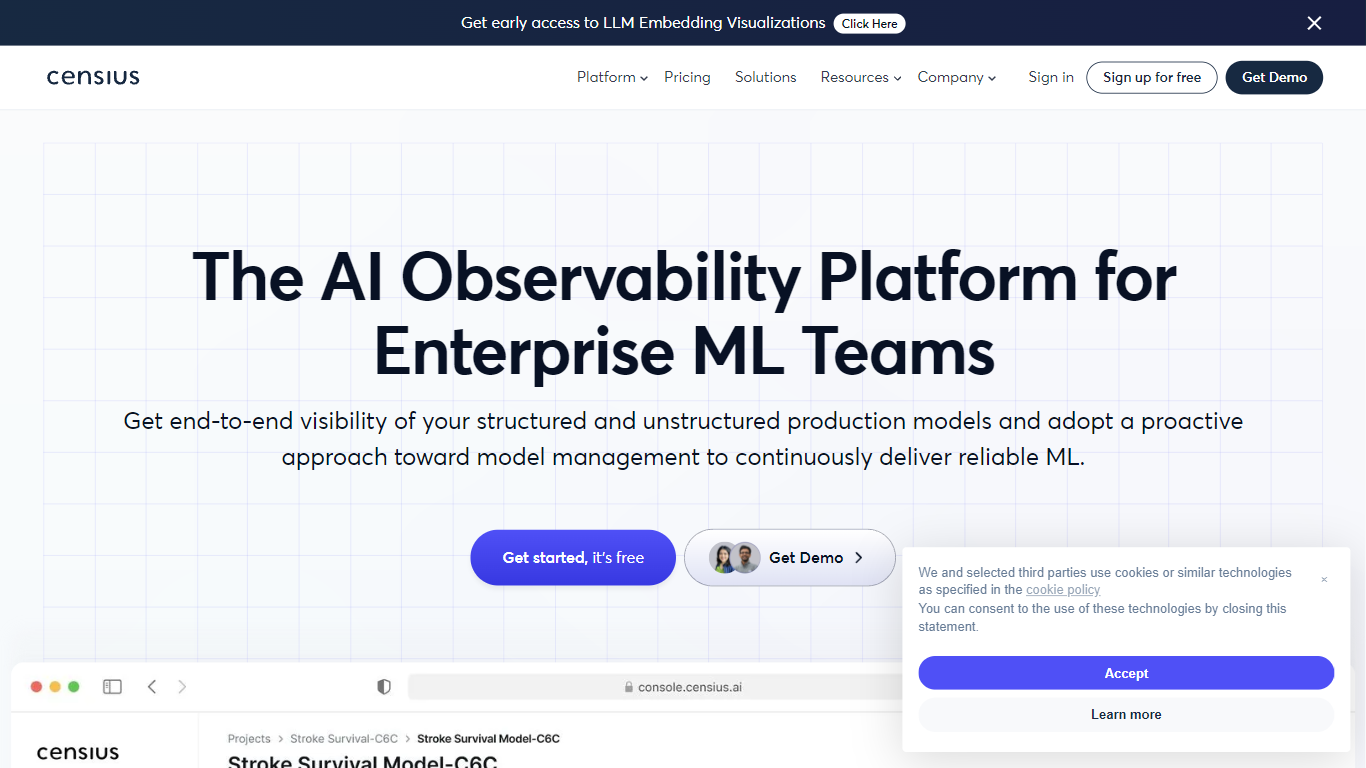
Censius gives ML teams a single console to watch production models after deployment. You register datasets and models, stream predictions through a Python SDK or REST API, and Censius auto-builds monitors for performance, drift, data quality, and activity volume. Violations surface in dashboards with paths into root cause analysis instead of manual log digging.
Where many monitoring tools stop at accuracy charts, Censius ties monitoring to explainability. SHAP values show which features pushed each prediction, and guided workflows connect monitor alerts to the segments or model versions that triggered them. The platform also supports custom business metrics alongside standard scores like F1, sensitivity, and specificity.
Integration stays practical for enterprise stacks. Projects group models by client or use case, datasets register from CSV uploads, and bulk_log() batches daily prediction logs. Auto-initialized monitors can take 30 to 60 minutes after training data upload depending on feature count and dataset size. Logs aggregate every 60 minutes by default, with custom deployment frequencies available on request.
Data scientists use Censius to visualize assumptions in live models, while ML engineers catch pipeline bugs before users feel them. Business stakeholders get shareable dashboards for model health without reading raw telemetry. Access starts through the web console at console.censius.ai or by requesting a tenant via the signup flow.
Four monitor families cover performance, drift, data quality, and prediction volume
Python SDK installs via pip install censius with REST API and Java SDK options
SHAP explainability shows per-feature contribution to individual predictions
Auto-initialized monitors build from uploaded training data in 30 to 60 minutes
bulk_log() sends predictions, actuals, and explanations in one daily batch call
Unlimited models and model versions under configurable performance and drift monitors
Production logs aggregate every 60 minutes by default across deployed models
Combines monitoring, explainability, and analytics in one observability workflow
Auto-builds monitors from training data so teams skip manual threshold setup
Supports custom business metrics alongside standard classification scores
Python SDK covers single predictions, delayed actuals, and bulk daily log batches
Primary marketing site censius.ai was unreachable during research; docs live on documentation.censius.ai
Auto-monitor initialization can take up to an hour for large training datasets
Dataset uploads accept CSV only through the documented register_dataset API
What does Censius monitor in production models?
Censius monitors model performance metrics like accuracy, F1, sensitivity, and specificity, plus drift, data quality issues such as missing or out-of-range values, and activity volume drops. Alerts fire when thresholds breach so teams can investigate before users notice.
How do you integrate Censius with a production pipeline?
Censius integrates through the censius Python package, a Java SDK, or REST API. You create a CensiusClient with an API key and project ID, register datasets and models, then call log() for each prediction or bulk_log() for batched logs.
Does Censius explain individual model predictions?
Yes. Censius uses SHAP (Shapley Additive Explanations) to show how each feature value pushed a specific prediction higher or lower. Red and blue SHAP plots highlight feature direction and magnitude for local and global interpretation.
What model types does Censius support?
Censius supports binary classification and regression model types through register_model(). Datasets upload as CSV files with typed feature columns, and targets and features are declared when the model is registered to a project.
How long does Censius auto-monitor setup take?
After you upload a dataset and link a model, Censius auto-initializes monitors with preset thresholds from training data. Processing typically takes 30 to 60 minutes depending on feature count and training dataset size.
How do you access the Censius platform?
Teams log into the Censius web console at console.censius.ai with email credentials. Programmatic access uses an API key and tenant ID issued after signup, and new tenants can request access through the Censius get-started page.