DATAKU vs Censius
Explore the showdown between DATAKU vs Censius and find out which AI Data Science tool wins. We analyze upvotes, features, reviews, pricing, alternatives, and more.
In a face-off between DATAKU and Censius, which one takes the crown?
When we contrast DATAKU with Censius, both of which are exceptional AI-operated data science tools, and place them side by side, we can spot several crucial similarities and divergences. The upvote count shows a clear preference for DATAKU. DATAKU has received 7 upvotes from aitools.fyi users, while Censius has received 6 upvotes.
You don't agree with the result? Cast your vote to help us decide!
DATAKU

What is DATAKU?
DATAKU is a data science site that tracks AI benchmarks, API pricing, and model releases, then packages the numbers into free calculators and downloadable datasets. The homepage archives articles on inference costs, funding rounds, and head-to-head model comparisons, while the Tools section hosts eight utilities such as an LLM cost calculator, benchmark decoder, and model graveyard.
Most AI news sites summarize press releases. DATAKU cross-references provider docs, leaderboard scores, and its own pricing tables, which is why the downloadable datasets page lists 48-row pricing histories and 62-row benchmark score tables under CC BY 4.0 licenses.
Data analysts, ML engineers, and buyers use DATAKU when they need cost-per-token math, benchmark context, or CSV exports instead of marketing claims. The About page describes the project as benchmark and pricing tracking run by a former Tokyo data analyst.
Censius
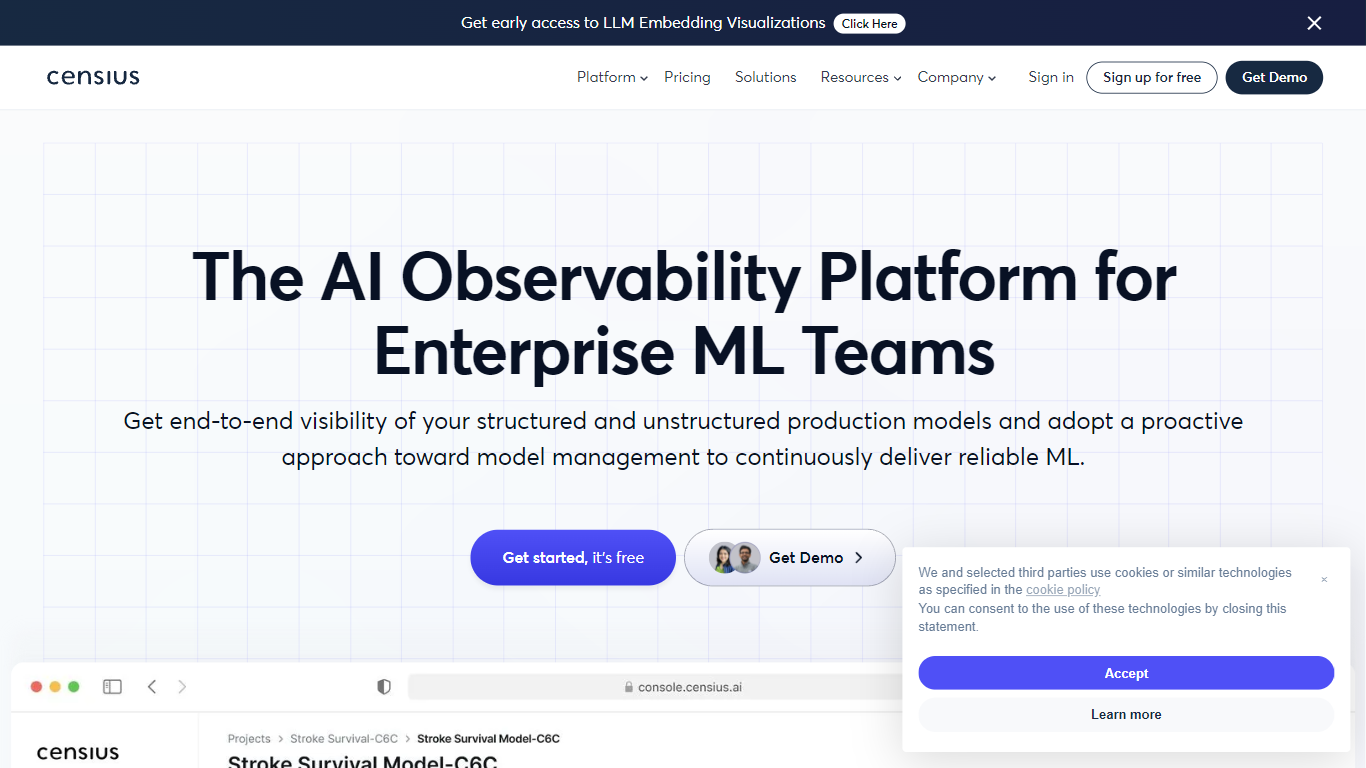
What is Censius?
Censius gives ML teams a single console to watch production models after deployment. You register datasets and models, stream predictions through a Python SDK or REST API, and Censius auto-builds monitors for performance, drift, data quality, and activity volume. Violations surface in dashboards with paths into root cause analysis instead of manual log digging.
Where many monitoring tools stop at accuracy charts, Censius ties monitoring to explainability. SHAP values show which features pushed each prediction, and guided workflows connect monitor alerts to the segments or model versions that triggered them. The platform also supports custom business metrics alongside standard scores like F1, sensitivity, and specificity.
Integration stays practical for enterprise stacks. Projects group models by client or use case, datasets register from CSV uploads, and bulk_log() batches daily prediction logs. Auto-initialized monitors can take 30 to 60 minutes after training data upload depending on feature count and dataset size. Logs aggregate every 60 minutes by default, with custom deployment frequencies available on request.
Data scientists use Censius to visualize assumptions in live models, while ML engineers catch pipeline bugs before users feel them. Business stakeholders get shareable dashboards for model health without reading raw telemetry. Access starts through the web console at console.censius.ai or by requesting a tenant via the signup flow.
DATAKU Upvotes
Censius Upvotes
DATAKU Top Features
LLM Cost Calculator estimates API spend across OpenAI, Anthropic, Google, Meta, and Mistral models
Benchmark Decoder explains what benchmarks measure and which models score highest
AI Training Data Tracker documents sources and cutoff dates for 18+ major models
Model Graveyard archives 25+ deprecated models with replacement notes
Downloadable datasets include 48-row pricing history and 62-row benchmark tables (CC BY 4.0)
AI Energy Calculator estimates watts, kWh, and CO2 per model query
Censius Top Features
Four monitor families cover performance, drift, data quality, and prediction volume
Python SDK installs via pip install censius with REST API and Java SDK options
SHAP explainability shows per-feature contribution to individual predictions
Auto-initialized monitors build from uploaded training data in 30 to 60 minutes
bulk_log() sends predictions, actuals, and explanations in one daily batch call
Unlimited models and model versions under configurable performance and drift monitors
Production logs aggregate every 60 minutes by default across deployed models
DATAKU Category
- Data Science
Censius Category
- Data Science
DATAKU Pricing Type
- Free
Censius Pricing Type
- Freemium