Vizzy vs STRING
When comparing Vizzy vs STRING, which AI Data Science tool shines brighter? We look at pricing, alternatives, upvotes, features, reviews, and more.
In a comparison between Vizzy and STRING, which one comes out on top?
When we put Vizzy and STRING side by side, both being AI-powered data science tools, The upvote count is neck and neck for both Vizzy and STRING. Since other aitools.fyi users could decide the winner, the ball is in your court now to cast your vote and help us determine the winner.
Does the result make you go "hmm"? Cast your vote and turn that frown upside down!
Vizzy

What is Vizzy ?
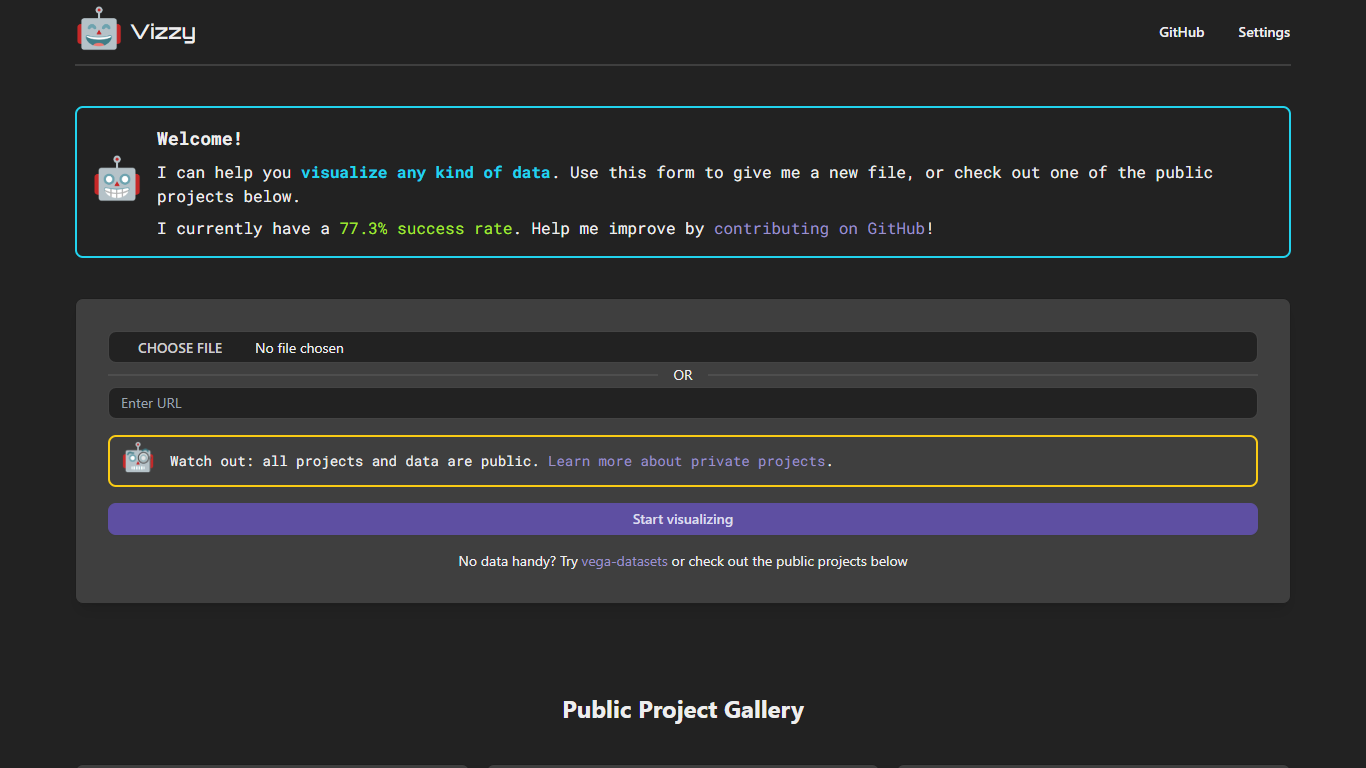
Vizzy is a data visualization platform that leverages Large Language Models (LLMs) to help users quickly transform raw data into clear visual stories. It supports a wide range of data types and formats, allowing both beginners and experienced analysts to create insightful charts, maps, and graphs without deep technical skills. Users connect their own OpenAI API key, ensuring data privacy as keys are stored only in the browser and not on Vizzy's servers. The platform offers a public project gallery showcasing diverse datasets like U.S. state obesity rates and national parks, encouraging exploration and learning. While currently open source and free to use with an OpenAI account, Vizzy plans to introduce paid features such as private projects and user management. Its interface guides users through data upload, exploration, and visualization creation, making complex data accessible and understandable. Vizzy is ideal for educators, researchers, journalists, and data enthusiasts who want rapid, AI-assisted visual analysis without coding.
STRING
What is STRING?
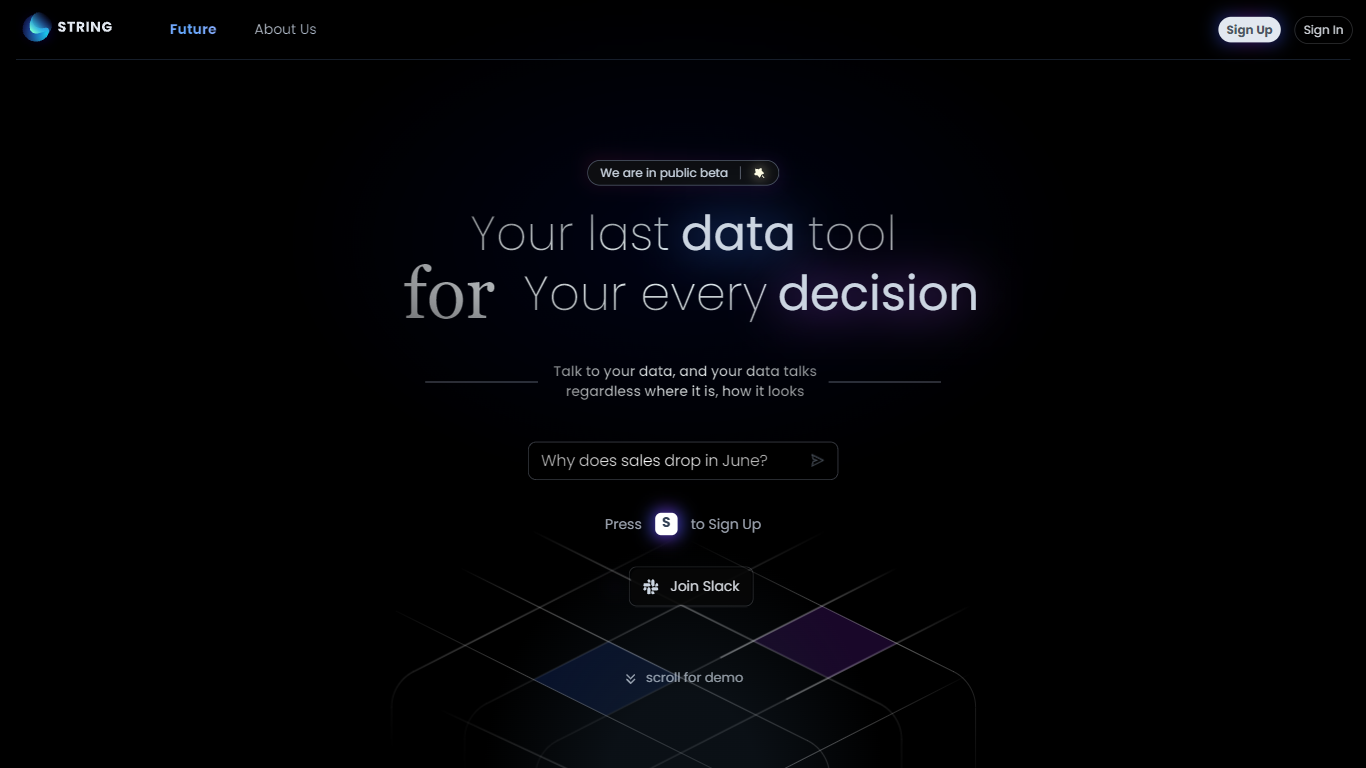
STRING lets you talk to your data through a conversational analytics interface marketed as your last data tool. You sign up for the public beta, connect sources wherever they live, and ask questions in natural language instead of building dashboards first. The product pitch centers on decisions: your data answers back regardless of format or location.
Legacy BI stacks expect hours of SQL and chart assembly before you get a useful answer. STRING's team, with backgrounds at Google, Uber, CMU, and UW, frames the product around AGI-style analytics that listens, understands unstructured text, and takes initiative beyond rigid queries. The Future page contrasts this with older tools that crunch structured tables slowly.
Data analysts, product managers, and operators who want quick answers without standing up a full BI project fit STRING best. It is still in public beta with Slack community access, so teams should expect evolving features rather than a finished enterprise contract page.
Vizzy Upvotes
STRING Upvotes
Vizzy Top Features
🔑 Connect your own OpenAI API key for secure data processing
📊 Create diverse visualizations like maps, timelines, and heatmaps easily
🌐 Explore and fork public projects to learn and customize visualizations
🛠️ Open source platform allowing community contributions and transparency
📁 Upload CSV or JSON data files directly for instant visualization
STRING Top Features
Natural language interface to query data without pre-built dashboard workflows
Public beta signup with Slack community invite for early users
Designed to handle structured databases and unstructured sources like docs and notes
Team includes alumni from Google, Uber, Carnegie Mellon, and University of Washington
Slack community invite linked on homepage for public beta testers
Future roadmap targets proactive analytics that initiates insights beyond user prompts
Vizzy Category
- Data Science
STRING Category
- Data Science
Vizzy Pricing Type
- Freemium
STRING Pricing Type
- Freemium