
Last updated 10-23-2025
Category:
Reviews:
Join thousands of AI enthusiasts in the World of AI!
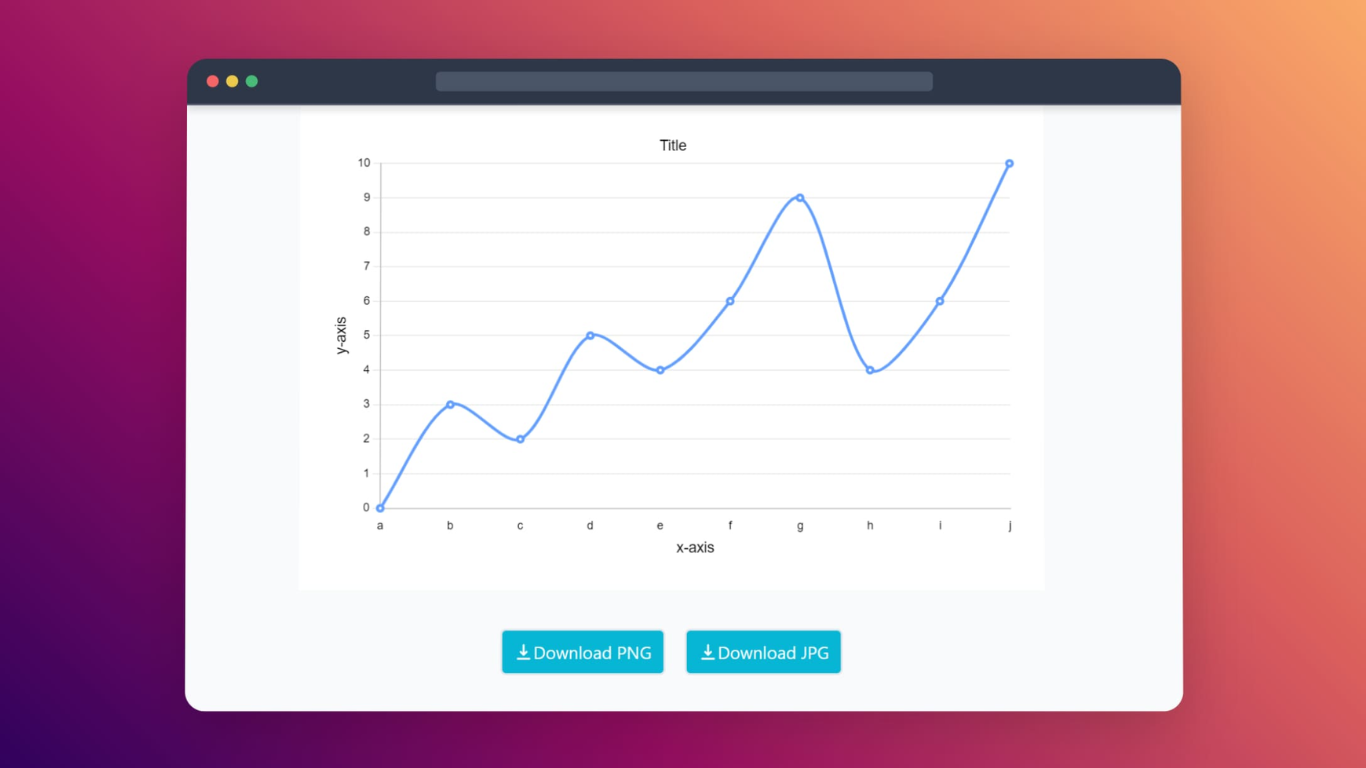
Line Graph Maker
Line Graph Maker is a straightforward online tool that lets users create clear and customizable line graphs for free. You start by adding a graph title and labeling the horizontal and vertical axes. Then, enter your data labels and corresponding values separated by commas to quickly populate your graph.
The tool offers options to adjust the line tension, choose the line color, and decide whether the Y-axis starts at zero. You can also control the legend's position and alignment, and toggle grid lines on both axes to suit your presentation style.
Beyond line graphs, the platform also provides other chart types like bar graphs, pie charts, doughnut charts, scatter charts, and radar charts, making it a versatile choice for various data visualization needs.
Once your graph is ready, you can download it in PNG, JPG, or SVG formats, which works well for reports, presentations, or online sharing. This makes it a handy resource for students, educators, professionals, and anyone needing quick, effective visual data representation.
The interface is designed to be user-friendly, requiring no prior design or coding skills. It supports both linear and logarithmic scales for the Y-axis, adding flexibility for different data sets.
While the tool focuses on simplicity, it provides enough customization to create visually appealing and informative graphs without overwhelming the user. It’s a practical solution for those who want to visualize data quickly without installing software or dealing with complex tools.
Overall, Line Graph Maker stands out for its ease of use, free access, and variety of chart options, making it a reliable choice for basic to intermediate data visualization tasks.
🎨 Customizable Line Styles: Adjust line tension and color to make your graph visually appealing and clear.
📊 Multiple Chart Types: Besides line graphs, create bar, pie, doughnut, scatter, and radar charts all in one place.
📥 Easy Downloads: Export your graphs as PNG, JPG, or SVG files for use in presentations or reports.
📍 Legend Control: Position and align the legend anywhere on the chart for better readability.
📈 Scale Options: Choose between linear and logarithmic Y-axis scales to best fit your data representation.
No cost to use with full access to all basic features.
Supports multiple chart types beyond just line graphs.
Simple interface that requires no technical skills.
Allows downloading in multiple popular image formats including SVG for scalability.
Offers customization options like line tension and legend placement.
Limited advanced data analysis or interactive features.
No option to save projects online or collaborate with others.
Customization options are basic compared to professional graphing software.
Can I create other types of charts besides line graphs?
Yes, Line Graph Maker also supports bar graphs, pie charts, doughnut charts, scatter charts, and radar charts all within the same platform.
What file formats can I download my graph in?
You can download your graphs as PNG, JPG, or SVG files, allowing for easy use in presentations, reports, or online.
Is there a way to customize the Y-axis scale?
Yes, you can choose between a linear or logarithmic scale for the Y-axis depending on your data needs.
Do I need to create an account to use Line Graph Maker?
No account is required; you can create and download graphs directly without signing up.
Can I adjust the position of the legend on my graph?
Yes, the tool lets you position the legend at the top, left, bottom, right, or within the chart area, and align it as needed.
Is Line Graph Maker suitable for professional presentations?
Absolutely, the tool produces clean, customizable graphs that can be downloaded in high-quality formats suitable for professional use.
Are there any costs or limitations on usage?
Line Graph Maker is completely free to use with no stated limits on the number of graphs you can create or download.