
Last updated 08-11-2026
Category:
Reviews:
Join thousands of AI enthusiasts in the World of AI!
Harbor Scale (formerly Telemetry Harbor)
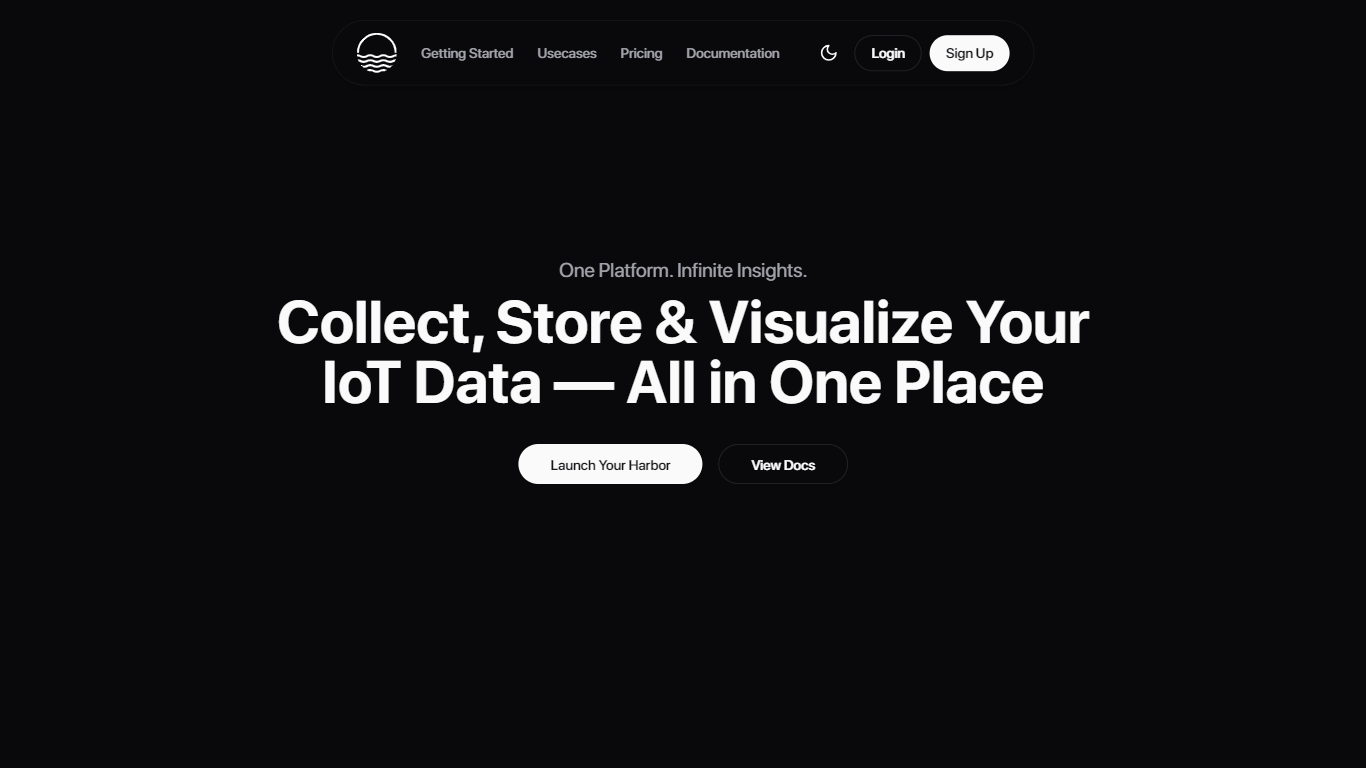
Harbor Scale streams sensor and server metrics into managed Grafana dashboards. You point ESP32 boards, Linux hosts, or Docker containers at the Harbor API and get live charts without provisioning InfluxDB or writing YAML configs yourself.
DIY Grafana stacks take hours to wire up and cost real developer time each month. Harbor Scale advertises sub-60-second onboarding with pre-connected Grafana, batch ingestion up to 1,000 points per call on the Pro plan, and a Python SDK you can start with four lines of code. The free tier still includes managed Grafana access, which most cloud monitoring vendors charge extra for.
It targets makers shipping ESP32 or LoRaWAN hardware, DevOps teams tired of maintaining Telegraf configs, and anyone who wants Grafana visuals without running the backend. Plans run from a free 50K-point tier through $9 and $29 monthly tiers with longer retention and higher batch limits.
Free Harbor tier includes 50K data points and managed Grafana access at $0 per month
Maker Harbor at $9 per month stores 5 million points with 90-day retention
Pro Harbor raises batch size to 1,000 data points per API call at $29 per month
Python SDK connects with four lines of code to the harborscale.com API
Lighthouse agent installs on Linux and Docker hosts with a one-line script
Supports ESP32, Arduino, MicroPython, Node.js, and The Things Network out of the box
Free tier includes managed Grafana without extra subscription fees
Homepage claims sub-60-second setup versus hours for DIY Grafana stacks
Broad hardware support from ESP32 to Linux Docker hosts
Python SDK needs only four lines to start streaming data
Paid plans scale to 10 million data points with 180-day retention
Free tier retains only 1 day of data
Batch limits cap at 100 points on the free plan
Product now lives at harborscale.com while the listing URL still redirects from telemetryharbor.com
What is Harbor Scale?
Harbor Scale is an IoT and infrastructure monitoring platform that ingests telemetry from devices and servers into managed Grafana dashboards. It is the current product behind the telemetryharbor.com domain, which redirects to harborscale.com.
Is Harbor Scale free?
Yes. Harbor Scale offers a Free Harbor plan at $0 per month with 50K data points, 1-day retention, and managed Grafana access. Paid Maker and Pro tiers start at $9 and $29 per month.
How fast is Harbor Scale setup?
Harbor Scale advertises getting data into Grafana dashboards in under 60 seconds. The Lighthouse agent for Linux and Docker installs with a one-line script and auto-detects CPU, RAM, disk, and network metrics.
What devices work with Harbor Scale?
Harbor Scale lists support for ESP32, Arduino, MicroPython, ESP8266, Linux agents, Node.js, Meshtastic, The Things Network, Home Assistant, and custom REST API integrations on its pricing page.
Does Harbor Scale include Grafana?
Yes. All Harbor Scale plans include managed Grafana access. The Free Harbor tier provides pre-configured Grafana dashboards without a separate Grafana Cloud subscription.
What are Harbor Scale AI questions?
Harbor Scale includes an AI assistant that analyzes telemetry for anomalies and trends. The Free plan allows 10 AI questions per day, Maker allows 20, and Pro allows 50.