CalcGen AI vs Line Graph Maker
Dive into the comparison of CalcGen AI vs Line Graph Maker and discover which AI Analytics tool stands out. We examine alternatives, upvotes, features, reviews, pricing, and beyond.
In a comparison between CalcGen AI and Line Graph Maker, which one comes out on top?
When we compare CalcGen AI and Line Graph Maker, two exceptional analytics tools powered by artificial intelligence, and place them side by side, several key similarities and differences come to light. With more upvotes, Line Graph Maker is the preferred choice. Line Graph Maker has 8 upvotes, and CalcGen AI has 6 upvotes.
Feeling rebellious? Cast your vote and shake things up!
CalcGen AI

What is CalcGen AI?
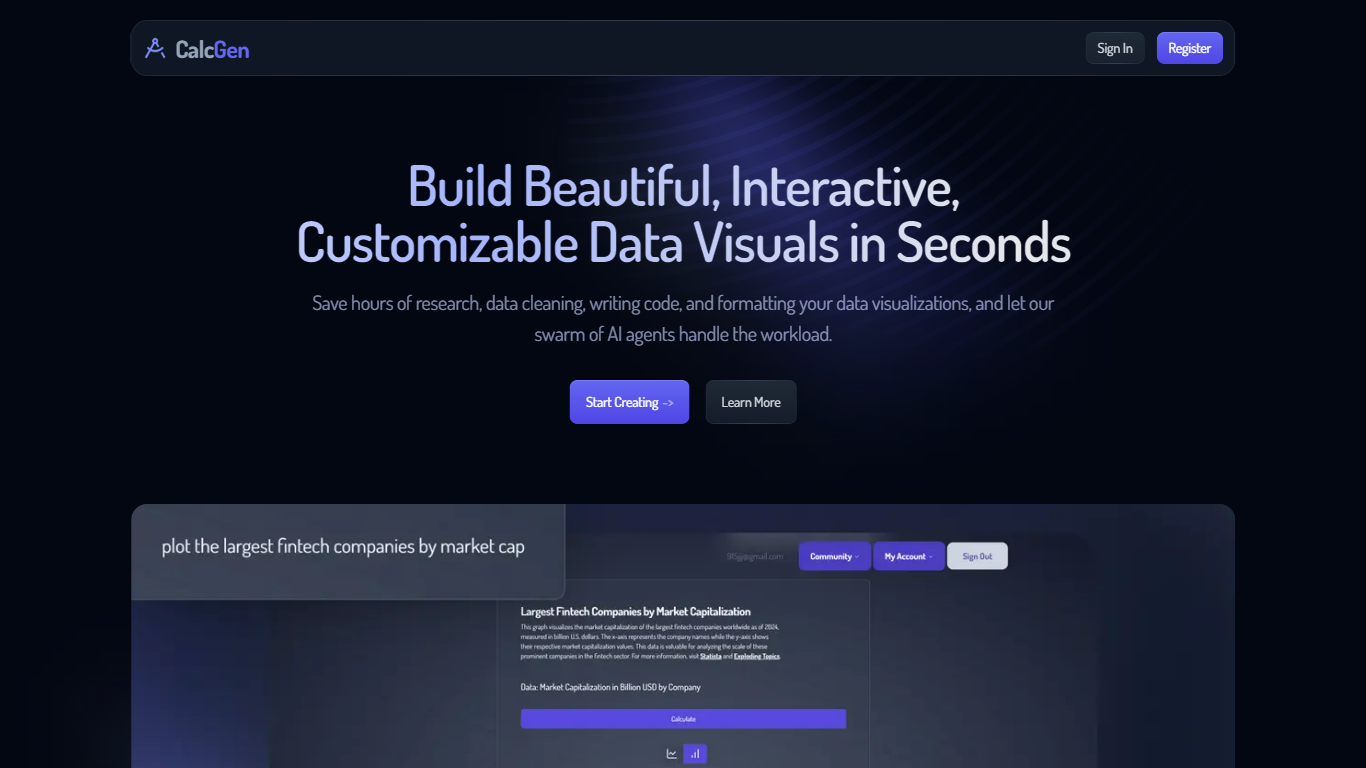
CalcGen AI is a powerful multi-agent platform designed to create beautiful, interactive, and customizable data visualizations in a matter of seconds. Its core functionality revolves around automating the tedious tasks of research, data cleaning, and formatting, allowing users to focus on the insights derived from their data. By leveraging a swarm of AI agents, CalcGen AI can handle complex queries and generate visualizations that are not only aesthetically pleasing but also informative and accurate. This makes it an invaluable tool for anyone looking to present data effectively without the usual hassle of manual preparation.
The target audience for CalcGen AI includes professionals, educators, and students who require quick and reliable data visualizations for presentations, reports, or educational purposes. Whether you are a business analyst needing to visualize sales data, a teacher preparing a lesson, or a student working on a project, CalcGen AI caters to a wide range of users who value efficiency and quality in data representation. The platform's user-friendly interface ensures that even those with minimal technical skills can create stunning visuals effortlessly.
One of the unique value propositions of CalcGen AI is its ability to automate the entire process of data visualization. Users can simply input a prompt, and the AI agents will collaborate to produce a visualization that meets their specifications. This not only saves time but also reduces the likelihood of errors that can occur during manual data handling. Additionally, the platform provides links to credible sources used in the research process, enhancing the reliability of the visualizations created.
Key differentiators of CalcGen AI include its intuitive interface, customizable themes, and the ability to integrate seamlessly with various platforms such as Notion, PowerPoint, and WordPress. Users can tailor their visualizations to align with their brand's design language, ensuring that the final product is not only functional but also visually appealing. Furthermore, the platform offers full support through a library of tutorials and guides, making it easy for users to get started and maximize the tool's potential.
In terms of technical implementation, CalcGen AI utilizes advanced AI algorithms to facilitate data research and visualization. The platform's architecture allows for the integration of multiple data sources and the application of various filters and sorting options, giving users the flexibility to present their data in the most effective way possible. With plans starting at just $9.99, CalcGen AI is accessible to a wide audience, making it a go-to solution for anyone in need of high-quality data visualizations.
Line Graph Maker
What is Line Graph Maker?
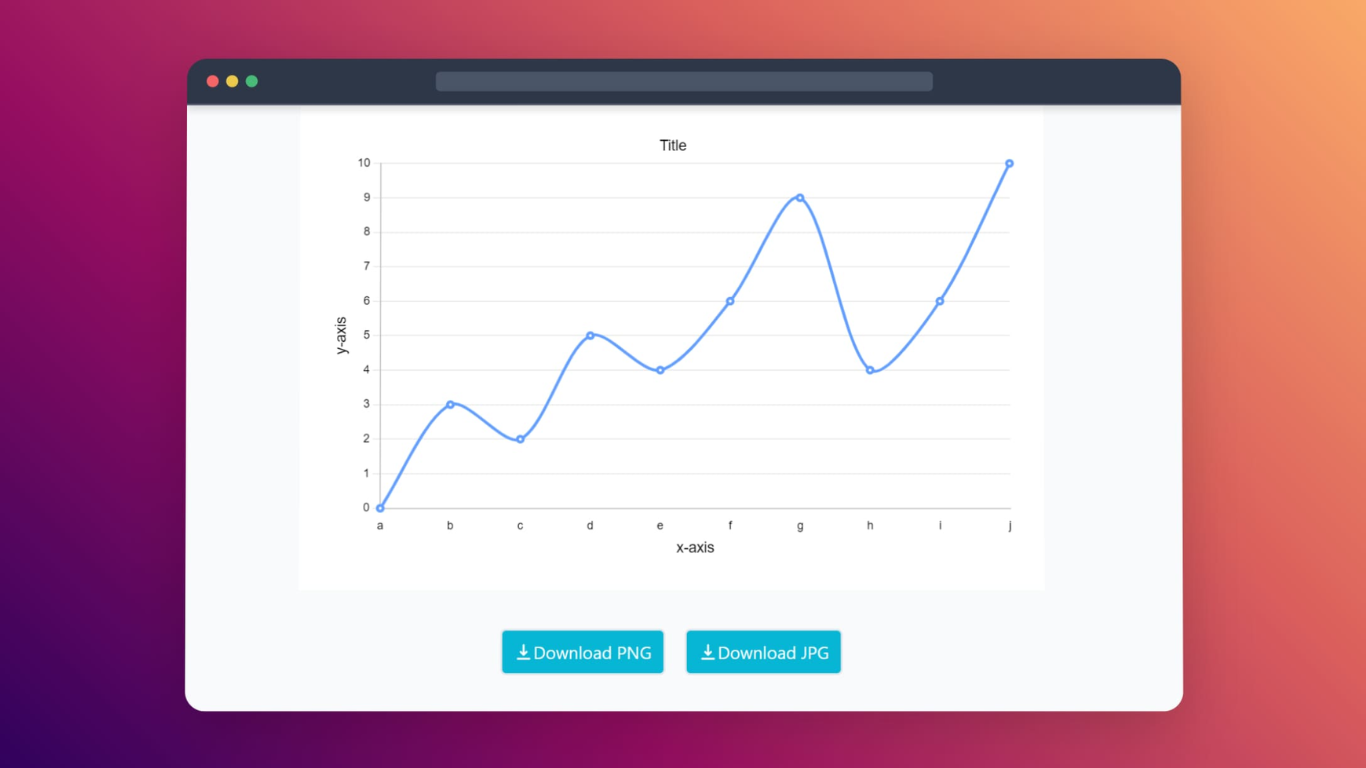
Line Graph Maker is a straightforward online tool that lets users create clear and customizable line graphs for free. You start by adding a graph title and labeling the horizontal and vertical axes. Then, enter your data labels and corresponding values separated by commas to quickly populate your graph.
The tool offers options to adjust the line tension, choose the line color, and decide whether the Y-axis starts at zero. You can also control the legend's position and alignment, and toggle grid lines on both axes to suit your presentation style.
Beyond line graphs, the platform also provides other chart types like bar graphs, pie charts, doughnut charts, scatter charts, and radar charts, making it a versatile choice for various data visualization needs.
Once your graph is ready, you can download it in PNG, JPG, or SVG formats, which works well for reports, presentations, or online sharing. This makes it a handy resource for students, educators, professionals, and anyone needing quick, effective visual data representation.
The interface is designed to be user-friendly, requiring no prior design or coding skills. It supports both linear and logarithmic scales for the Y-axis, adding flexibility for different data sets.
While the tool focuses on simplicity, it provides enough customization to create visually appealing and informative graphs without overwhelming the user. It’s a practical solution for those who want to visualize data quickly without installing software or dealing with complex tools.
Overall, Line Graph Maker stands out for its ease of use, free access, and variety of chart options, making it a reliable choice for basic to intermediate data visualization tasks.
CalcGen AI Upvotes
Line Graph Maker Upvotes
CalcGen AI Top Features
Automated Data Research: CalcGen AI can search the internet for relevant data and sources, saving users time and effort in finding information.
Customizable Visualizations: Users can tailor their charts and graphs to match their brand's style, ensuring a cohesive look across all presentations.
Intuitive Interface: The platform allows users to simply describe their data needs, and the AI agents handle the rest, making it easy for anyone to create visuals.
Integration Capabilities: CalcGen AI can be easily embedded into popular platforms like Notion, PowerPoint, and WordPress, allowing for versatile use.
Full Support and Resources: The platform offers a library of tutorials and guides, along with email support, to help users get started and troubleshoot any issues.
Line Graph Maker Top Features
🎨 Customizable Line Styles: Adjust line tension and color to make your graph visually appealing and clear.
📊 Multiple Chart Types: Besides line graphs, create bar, pie, doughnut, scatter, and radar charts all in one place.
📥 Easy Downloads: Export your graphs as PNG, JPG, or SVG files for use in presentations or reports.
📍 Legend Control: Position and align the legend anywhere on the chart for better readability.
📈 Scale Options: Choose between linear and logarithmic Y-axis scales to best fit your data representation.
CalcGen AI Category
- Analytics
Line Graph Maker Category
- Analytics
CalcGen AI Pricing Type
- Paid
Line Graph Maker Pricing Type
- Free