CalcGen AI vs Vizly
In the battle of CalcGen AI vs Vizly, which AI tool comes out on top? We compare reviews, pricing, alternatives, upvotes, features, and more.
Between CalcGen AI and Vizly, which one is superior?
Upon comparing CalcGen AI with Vizly, which are both AI-powered tools, Interestingly, both tools have managed to secure the same number of upvotes. Join the aitools.fyi users in deciding the winner by casting your vote.
Don't agree with the result? Cast your vote and be a part of the decision-making process!
CalcGen AI

What is CalcGen AI?
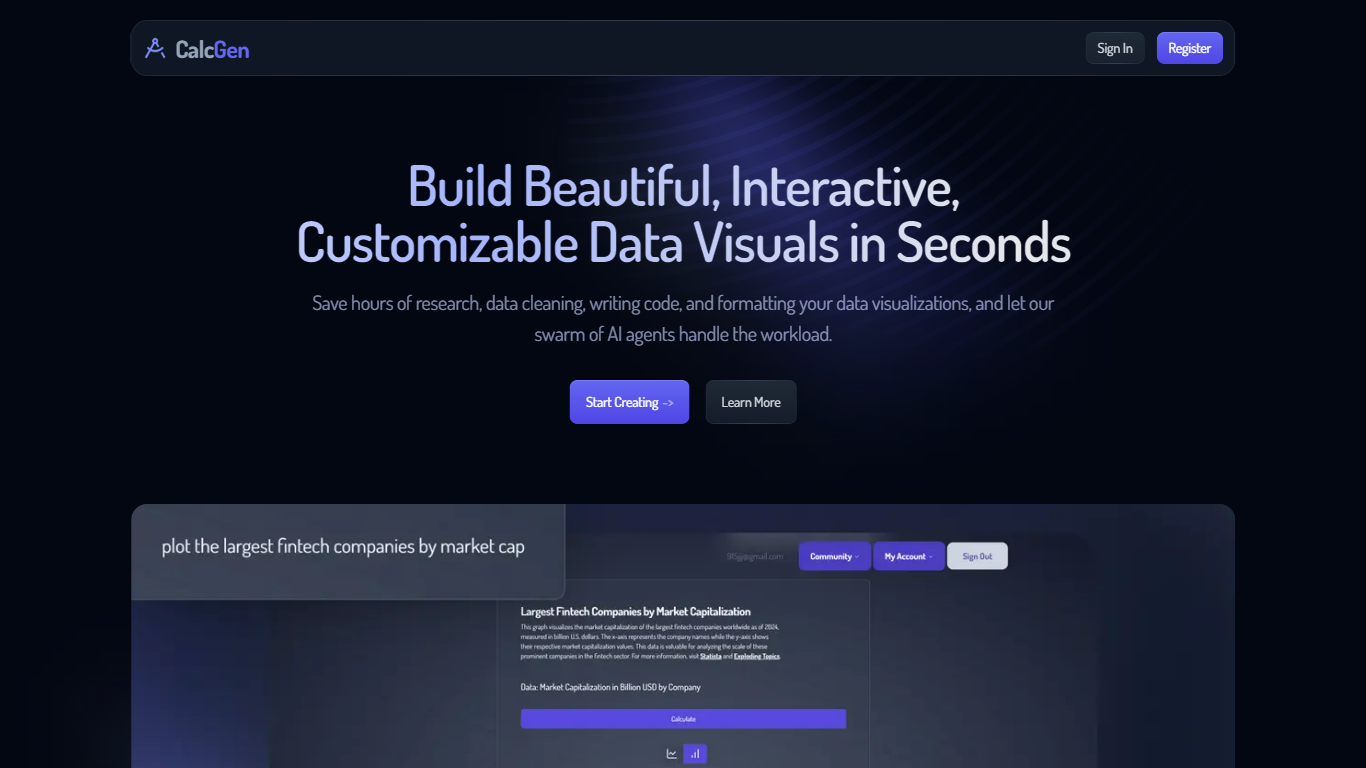
CalcGen AI turns a plain-language question into an interactive chart, graph, or calculator without you writing code or hunting down datasets. Type a prompt like smoking rates in the USA, and a swarm of search, analysis, and visualization agents finds credible sources, writes a summary, and renders a shareable visual you can embed in Notion, PowerPoint, or WordPress.
ChatGPT can sketch a chart from data you paste in. CalcGen goes further by sending a search agent to pull numbers from the web, linking every source, and letting you customize themes, filters, and chart types in a visual editor. The trade-off is beta maturity: the tutorial recommends datasets under 150 points for best results.
Analysts, educators, and marketers use it when they need a polished visualization fast but lack time for spreadsheet cleanup and formatting. CalcGen was featured on Product Hunt as a top 8 launch and in Rundown AI's trending products list in October 2024.
Vizly
What is Vizly?
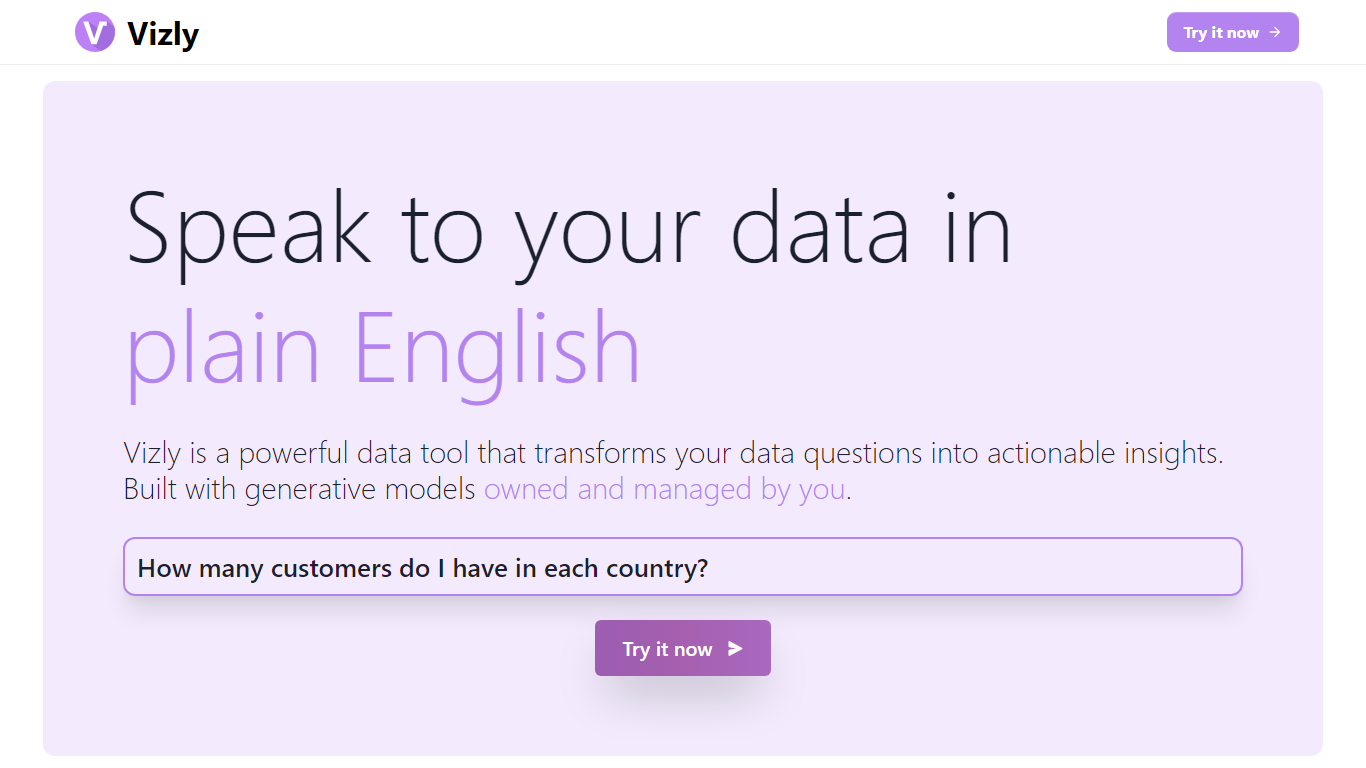
Vizly turns spreadsheet uploads into charts and statistical answers through a chat interface. Upload Excel, CSV, or SPSS files, ask questions in plain language, and get interactive Plotly visualizations, regression lines, and correlation matrices back. A private Python sandbox handles machine learning when you need more than summary stats.
Where Tableau and Looker focus on dashboards you configure by hand, Vizly leans on conversational analysis. You describe what you want to know and the app generates visuals on the fly. The trade-off is less pixel-perfect dashboard control in exchange for faster exploratory analysis.
Vizly suits students, analysts, and researchers in healthcare, finance, and genetics who need quick charts without writing notebook code. Premium adds unlimited messages, persistent files between sessions, and high-performance coding environments for heavier workloads.
CalcGen AI Upvotes
Vizly Upvotes
CalcGen AI Top Features
Search Agent finds data online and links credible sources to every visualization
Analysis Agent writes chart titles and detailed data summaries automatically
Visualization Agent builds interactive charts with custom filters and sorting from prompts
Embeds into Notion, PowerPoint, WordPress, Wix, and Miro
Theme library lets you match charts to your brand design language
Custom graph calculators plot equations dynamically from user inputs
Paid plans start at $9.99 per month according to the welcome page
Vizly Top Features
Chat interface generates Plotly visualizations and statistical analysis from uploaded files
Supports Excel, CSV, and SPSS with built-in data cleaning tools
Private Python code sandbox for machine learning and predictive modeling
Premium plan offers unlimited messages and persistent files between sessions
Use-case templates for healthcare, finance, and genetic research workflows
CalcGen AI Category
- Analytics
Vizly Category
- Data Science
CalcGen AI Pricing Type
- Freemium
Vizly Pricing Type
- Freemium