Pie Chart Maker vs Tome
In the contest of Pie Chart Maker vs Tome, which AI Presentation tool is the champion? We evaluate pricing, alternatives, upvotes, features, reviews, and more.
If you had to choose between Pie Chart Maker and Tome, which one would you go for?
When we examine Pie Chart Maker and Tome, both of which are AI-enabled presentation tools, what unique characteristics do we discover? Pie Chart Maker is the clear winner in terms of upvotes. Pie Chart Maker has 7 upvotes, and Tome has 6 upvotes.
Not your cup of tea? Upvote your preferred tool and stir things up!
Pie Chart Maker

What is Pie Chart Maker?
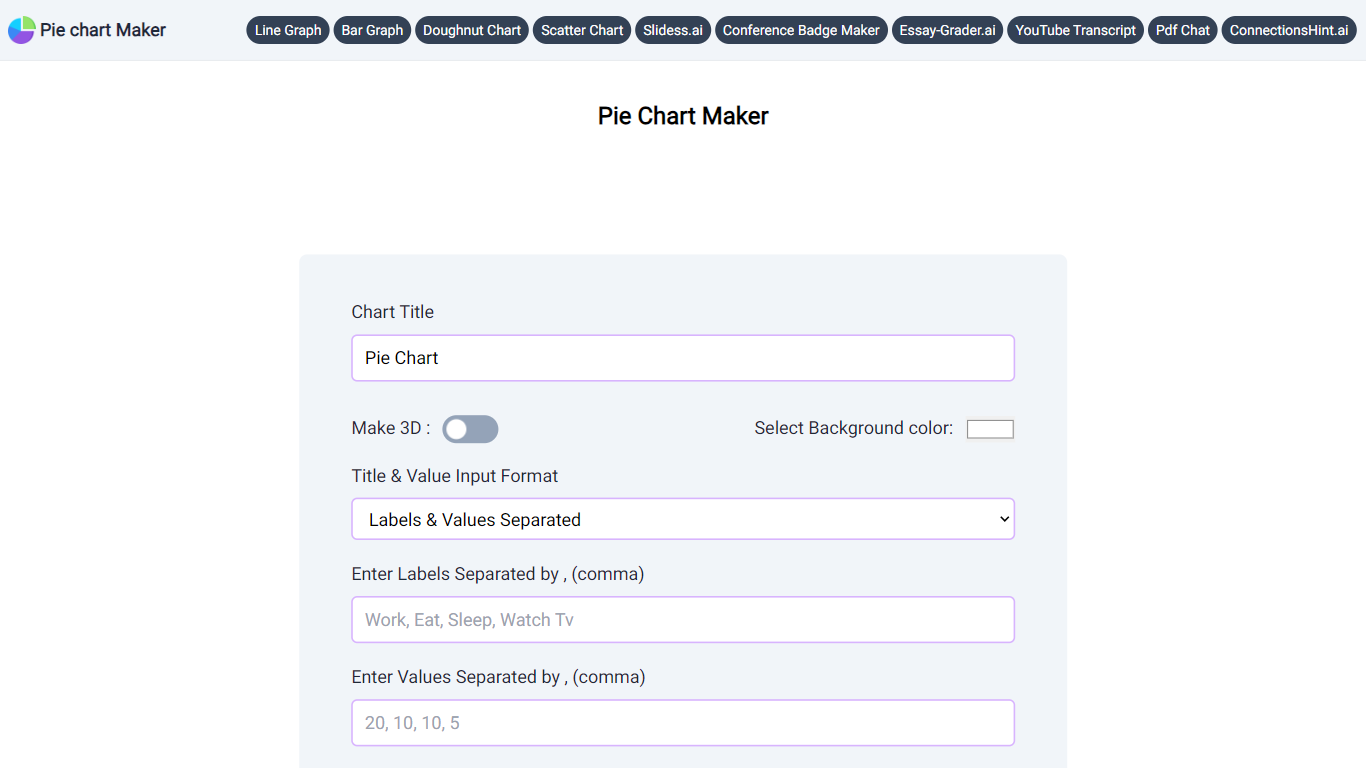
Pie Chart Maker is a free browser tool for building pie and doughnut charts without installing software. Enter labels and values, adjust colors, legend placement, rotation, and slice labels, then download the finished chart as PNG, JPEG, or SVG.
You can switch to a 3D view with one click, add a center hole to create a doughnut chart, and customize the background, title, and legend colors. The interface is built for quick edits, so students, teachers, and anyone presenting small datasets can produce a clean chart in minutes.
The site also links to related graph makers for line, bar, and scatter charts, plus other education-focused tools from the same publisher.
Tome

What is Tome?
Tome is a revolutionary platform designed to reshape and share ideas in a more streamlined and efficient manner. It offers a unique medium that stands apart from traditional decks, documents, or splash pages. Instead, Tome provides a fluid, multimedia canvas that is optimized for today's web-based communication, ensuring that it looks impeccable on any screen.
Use Cases:
Tome is versatile and caters to a wide range of users, from founders and entrepreneurs to educators and creatives. It offers templates for various purposes, such as fundraising pitches, product design reviews, sales pitches, and more.
Testimonials from users highlight Tome's ability to make sharing ideas more fluid and interactive, its intuitive design capabilities, and its time-saving features.
Pie Chart Maker Upvotes
Tome Upvotes
Pie Chart Maker Top Features
Enter comma-separated labels and values to generate a pie chart instantly
Switch to 3D view or add a pie hole to create a doughnut chart with one click
Customize background, title, legend colors, legend position, and chart rotation
Choose slice labels as percentage, value, label text, or none
Download finished charts as PNG, JPEG, or SVG at no cost
Related tools for line, bar, scatter, and doughnut charts on the same site
Tome Top Features
Expresión impulsada por IA: las herramientas de IA de Tome están diseñadas para ayudar a los usuarios a articular sus ideas sin esfuerzo. Ya sea que esté comenzando con una página en blanco o con un mensaje específico, Tome proporciona esquemas y opciones, lo que le permite encontrar la manera más efectiva de transmitir sus pensamientos.
Escritura y diseño mejorados: la plataforma utiliza inteligencia artificial para refinar el tono y la redacción de su contenido, crear las imágenes de acompañamiento perfectas e incluso buscar referencias en la web para enriquecer su narrativa.
Estructura y pulido: al pegar un documento en Tome, los usuarios pueden presenciar una transformación automática de su contenido. La plataforma construye una narrativa coherente a partir del texto y la combina con imágenes coincidentes para enfatizar los puntos principales.
Interactivo y dinámico: Tome no se trata sólo de páginas estáticas. Da vida a las ideas convirtiéndolas en experiencias ricas e interactivas. Esto incluye modelos 3D, animaciones y superposiciones audiovisuales.
Temas y diseños inteligentes: Diseñar con Tome es intuitivo, gracias a sus temas inteligentes y diseños responsivos que se ajustan automáticamente para verse geniales en cualquier dispositivo.
Integraciones: Tome admite la incorporación de simulacros de productos interactivos, prototipos 3D, datos, páginas web y más, con integraciones de plataformas como Figma, Spline, Twitter, YouTube, Framer y Miro.
Visualización inmersiva: Tome ofrece un modo de presentación inmersivo en pantalla completa, lo que garantiza que su contenido capte la atención que merece. Además, proporciona análisis para realizar un seguimiento de la participación de los espectadores.
Pie Chart Maker Category
- Presentation
Tome Category
- Presentation
Pie Chart Maker Pricing Type
- Free
Tome Pricing Type
- Paid