
Last updated 07-29-2026
Category:
Reviews:
Join thousands of AI enthusiasts in the World of AI!
Infographics So
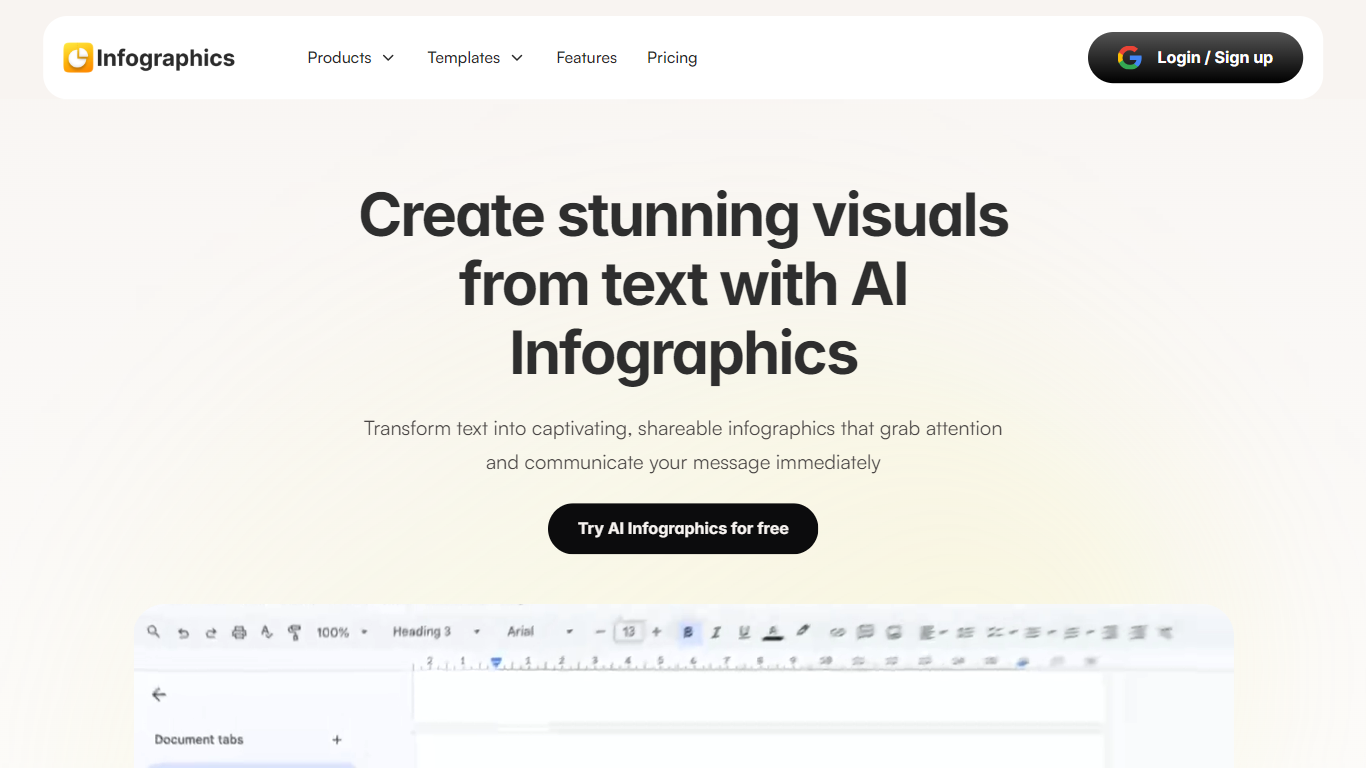
Infographics So is an AI-powered infographic generator that transforms ideas, stats, outlines, or sketches into polished, on-brand visuals in seconds. It supports a wide range of infographic types including process flows, comparisons, timelines, data visualizations, and list visuals, all created using multiple AI image models in one workspace. Designed for marketing and content teams, it allows users to drop in content, select a format, generate multiple design options side by side, and refine the chosen infographic with custom palettes and layouts.
The platform emphasizes editorial-quality output rather than fixed templates, offering styles from minimal to hand-drawn and isometric. Users can anchor designs on brand references to maintain consistent colors and fonts across campaigns. Infographics So provides high-resolution exports suitable for client decks, campaigns, social media, and printed materials, licensed for commercial use.
It is ideal for marketers, content creators, educators, and professionals who need fast, original, and customizable visuals without relying on traditional design software or templates.
Generate polished infographics from text, stats, or sketches in seconds ⚡
Compare multiple AI model outputs side by side to pick the best design 🔍
Customize colors, fonts, and layouts to match your brand style 🎨
Choose from diverse infographic types like timelines, comparisons, and data charts 📊
Export high-resolution visuals up to 4K for presentations and campaigns 📥
Supports multiple AI models for varied design strengths
Wide range of infographic types and styles available
High-resolution commercial-ready exports without watermarks
Easy brand customization with palette and typography locking
Fast generation with side-by-side design comparisons
No direct integration with popular design software mentioned
Some advanced features require paid subscription
Can AI actually generate a polished infographic?
Yes. Drop in a stat, an outline, a transcript, or a brand reference and Masonry generates editorial-quality infographics in seconds with legible typography and clean layouts.
What kinds of infographics can it generate?
Infographics So it can create process flows, comparisons, timelines, statistical strips, lists, data visualizations, hierarchical diagrams, anatomy breakdowns, geographic visuals, and editorial spreads.
Which AI model is best for infographics?
Infographics So different models excel at different tasks. Masonry lets you compare models like Ideogram, Recraft, Nano Banana Pro, FLUX, and Seedream side by side to pick the best result.
Will it render text in the image legibly?
Infographics So yes, especially when using Ideogram V3 Quality or Recraft V3, which produce clear in-image typography, labels, and callouts.
Is it free, and how much does it cost?
Infographics So you can start for free with limited generations and upgrade to Pro for unlimited use and higher-resolution exports at a fraction of freelance designer costs.
Can I keep my brand colors, fonts, and look?
Infographics So yes. You can anchor on a brand reference image, specify palettes and typography, and maintain consistent styles across campaigns.
Can I edit a generated infographic?
Infographics So yes. You can regenerate variations, swap palettes, edit sections, or export for further refinement in design tools like Figma or Illustrator.