
Last updated 08-21-2026
Category:
Reviews:
Join thousands of AI enthusiasts in the World of AI!
Uptrace
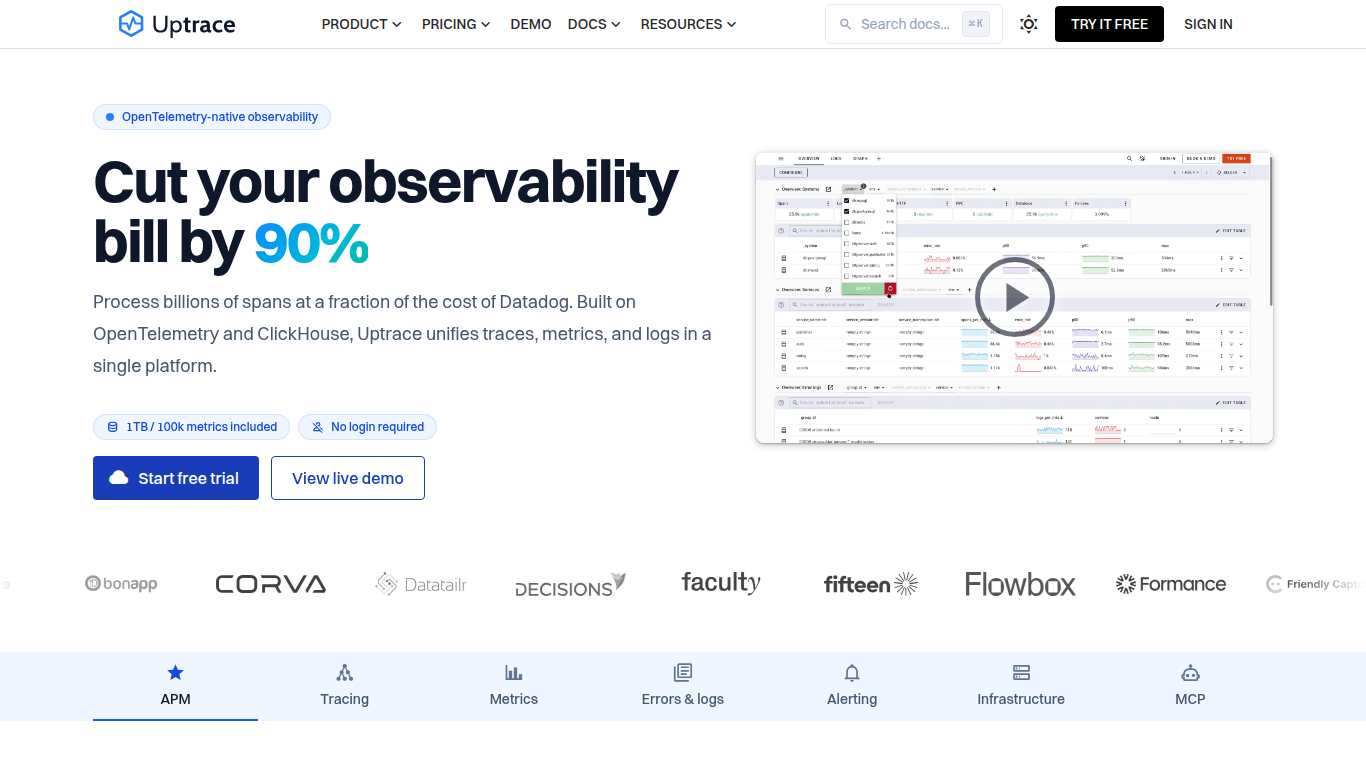
Uptrace unifies traces, metrics, and logs in one OpenTelemetry-native observability platform. SREs, platform engineers, and backend teams use it for full-stack APM without per-seat pricing or proprietary agents. You can run Uptrace Cloud, self-host the community edition, or deploy on-premises with a license.
Unlike Datadog and New Relic, Uptrace charges by data ingested, not per seat or host. Cloud includes 50 GB of traces, logs, and metrics free each month, then rates start at $0.075 per GB. The backend runs on ClickHouse, a columnar database built for petabyte-scale analytics that keeps ingest costs low at high cardinality.
Uptrace fits teams running microservices, Kubernetes workloads, or distributed backends who need correlated signals when debugging production incidents. Instrument once with OpenTelemetry SDKs or auto-instrumentation for Go, Python, Node.js, Java, Ruby, and a dozen other languages, then switch backends without re-writing application code.
Traces, metrics, and logs correlated in one queryable platform
50 GB free per month on Uptrace Cloud, then from $0.075 per GB ingested
Built on ClickHouse for petabyte-scale span and log storage
Native OTLP over gRPC and HTTP with auto-instrumentation for 20+ languages
Interactive service maps with real-time dependency health
Self-host free forever or run Uptrace Cloud with usage-based pricing
Ingest from Prometheus, Vector, FluentBit, and CloudWatch alongside OTel
Open source Community Edition with unlimited self-hosted usage at no cost.
No per-seat or per-host fees on cloud or self-hosted plans.
OpenTelemetry-native instrumentation avoids proprietary agent lock-in.
ClickHouse backend handles high-cardinality spans and logs at scale.
Public live demo lets you explore the product without signing up.
Cloud data centers are EU-only, which may add latency for US-heavy workloads.
Self-hosted paid editions require managing your own infrastructure.
Extended retention beyond 28 days costs extra on Uptrace Cloud.
Does Uptrace have a free tier?
Yes. Uptrace offers two free options. Self-host the Community Edition on your own infrastructure with no limits, or use Uptrace Cloud free up to 50 GB and 5,000 timeseries per month. Cloud signups also include a 14-day trial with 1.2 TB of spans and logs and 100,000 timeseries, with no credit card required.
How does Uptrace Cloud pricing work?
Uptrace Cloud charges by data ingested, not per seat or per host. You get 50 GB of traces, logs, and metrics free each month. After that, rates start at $0.075 per GB for traces and logs. Metrics are billed per million datapoints starting at $0.025. You can set a hard monthly budget cap so billing never exceeds your limit.
Can I self-host Uptrace?
Yes. Uptrace Community Edition is open source and free to self-host with unlimited usage. Paid self-hosted editions (Starter, Team, Business) add collaboration features like RBAC, SSO, and alert routing at flat monthly rates starting at $39 per month. Enterprise on-premises deployments include dedicated support and SOC 2 certification on request.
Is Uptrace compatible with OpenTelemetry?
Yes. Uptrace is built on the OpenTelemetry standard and accepts native OTLP data over gRPC and HTTP. It supports auto-instrumentation for Go, Python, Node.js, Java, Ruby, Rust, PHP, and other languages. You can also forward Jaeger spans through the OpenTelemetry Collector without re-instrumenting your applications.
Where is Uptrace Cloud data stored?
Uptrace Cloud runs in Hetzner data centers in Germany with redundant backups in Finland. All telemetry data stays within the European Union for GDPR compliance. Default retention is 28 days, with optional cold storage on S3 or HDD for up to 100 weeks.
How is Uptrace different from Jaeger or Zipkin?
Jaeger and Zipkin store traces only. Uptrace stores traces, metrics, and logs together with automatic log-to-trace correlation, built-in alerting, and service health dashboards. That means you can follow a failing request from the trace waterfall to the relevant log lines without switching tools.