Formula Bot (formerly Excel Formula Bot) vs kasipa (formerly deepsheet)
Dive into the comparison of Formula Bot (formerly Excel Formula Bot) vs kasipa (formerly deepsheet) and discover which AI Excel tool stands out. We examine alternatives, upvotes, features, reviews, pricing, and beyond.
In a comparison between Formula Bot (formerly Excel Formula Bot) and kasipa (formerly deepsheet), which one comes out on top?
When we compare Formula Bot (formerly Excel Formula Bot) and kasipa (formerly deepsheet), two exceptional excel tools powered by artificial intelligence, and place them side by side, several key similarities and differences come to light. Neither tool takes the lead, as they both have the same upvote count. The power is in your hands! Cast your vote and have a say in deciding the winner.
Disagree with the result? Upvote your favorite tool and help it win!
Formula Bot (formerly Excel Formula Bot)
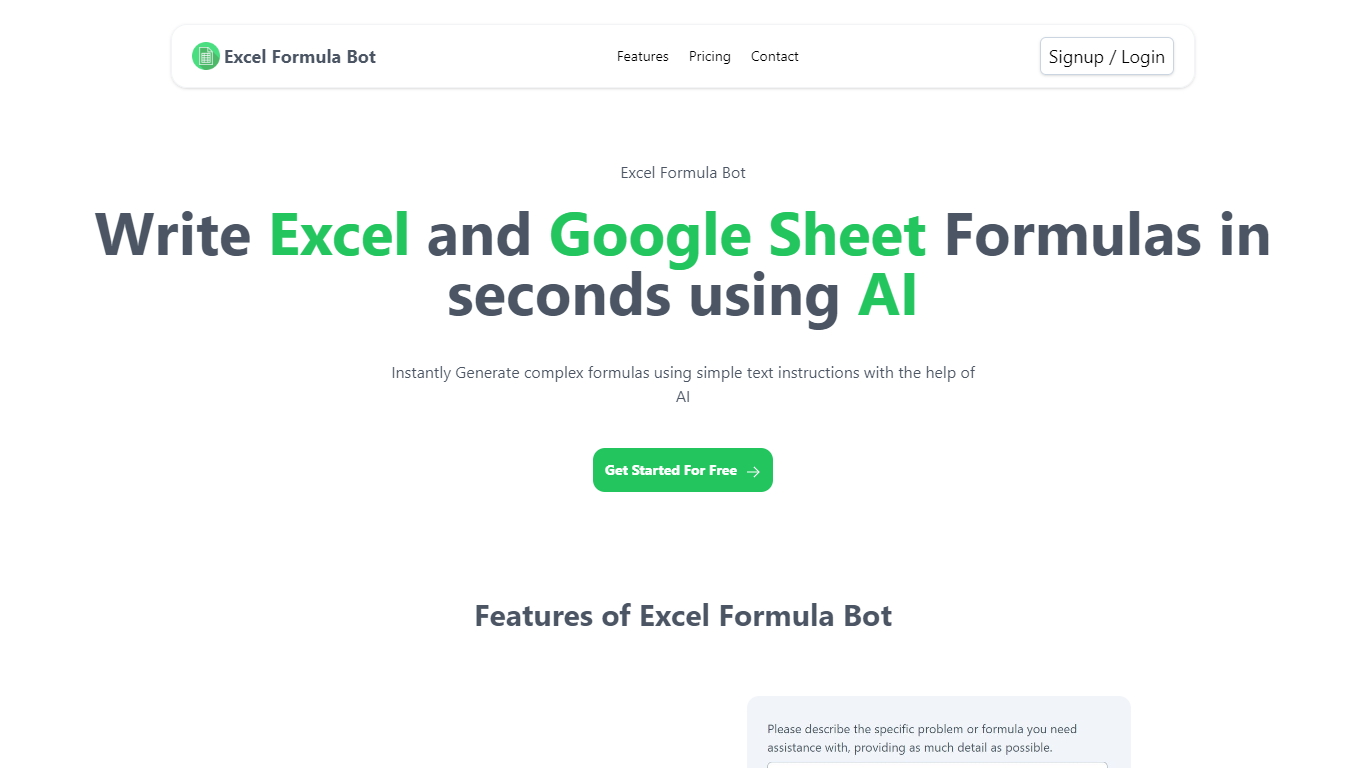

What is Formula Bot (formerly Excel Formula Bot)?
Formula Bot is a chat-based data analytics platform where you upload spreadsheets or connect databases, then ask questions in plain English to get formulas, charts, dashboards, and written insights back. It started as an Excel formula helper and now covers analysis, visualization, and scheduled reporting in one workspace.
The product runs analysis in an isolated sandbox and shows the Python, SQL, or R code behind each answer so you can verify results before exporting. You can also build interactive dashboards from templates, schedule Playbooks to refresh reports automatically, and embed analytics chat on your own site.
It fits analysts, finance teams, marketers, and business owners who live in Excel or Google Sheets but want faster answers without writing every formula or pivot by hand.
kasipa (formerly deepsheet)
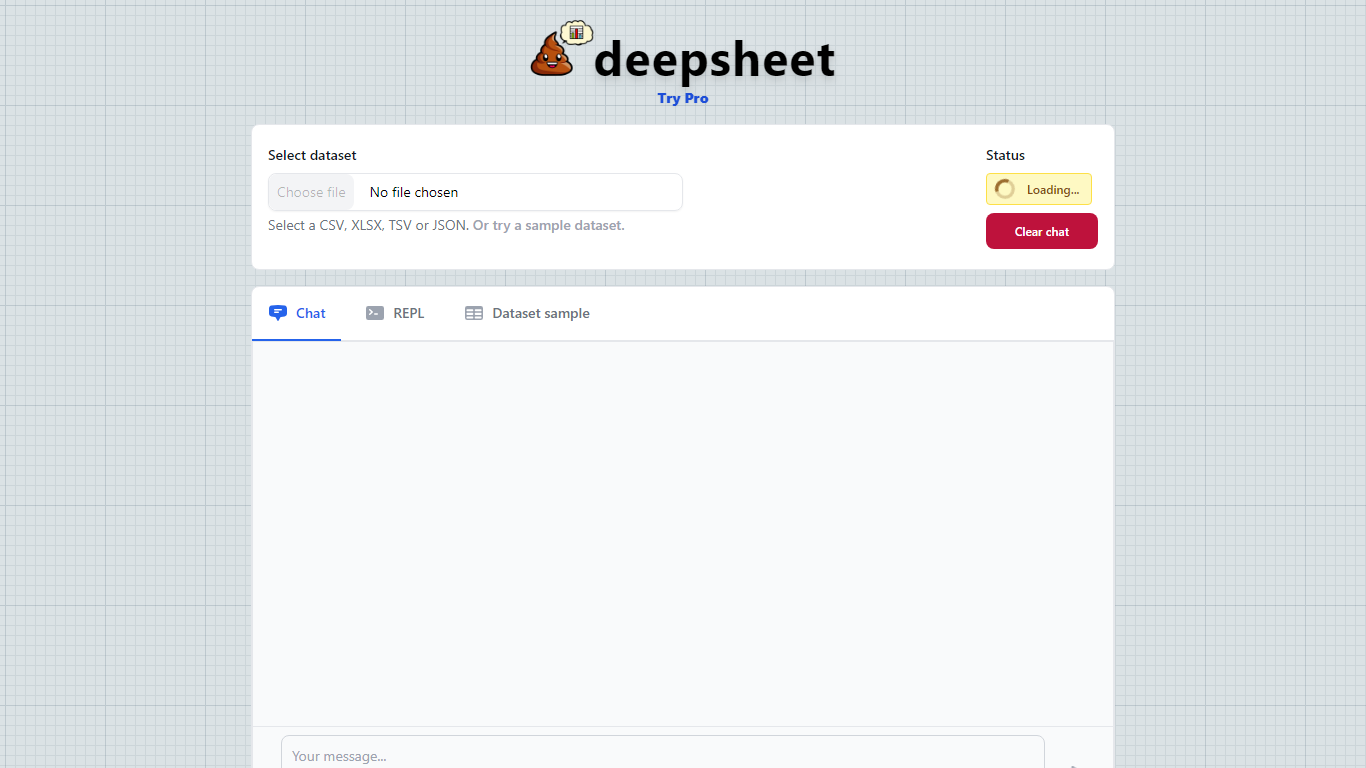
What is kasipa (formerly deepsheet)?
kasipa (formerly deepsheet) is a browser-based data visualization tool that turns spreadsheets into charts and analysis through plain-language questions. Upload a CSV, Excel file, or connect a Google Sheet, describe what you want to see, and get interactive Plotly charts without installing desktop software.
The product runs analysis locally in your browser using WebAssembly, so your spreadsheet data stays on your device during chart generation. You can start from the homepage without creating an account, then refine results with follow-up messages until the chart matches what you need.
Beyond one-off charts, kasipa includes a community showcase where users publish visualizations built from public-interest datasets. The tool also supports multi-sheet Excel workbooks, Google Sheets links, and dedicated CSV and Excel to chart landing pages for quick uploads.
Creator Dylan Castillo built kasipa for analysts, researchers, and business users who want spreadsheet insights without writing code or switching between multiple tools.
Formula Bot (formerly Excel Formula Bot) Upvotes
kasipa (formerly deepsheet) Upvotes
Formula Bot (formerly Excel Formula Bot) Top Features
Describe a calculation in plain English and get a paste-ready Excel or Google Sheets formula
Upload .xlsx, .csv, or connect PostgreSQL, BigQuery, Snowflake, and 10+ other sources
Build interactive dashboards from templates with click-to-edit charts and scheduled refreshes
Run sentiment analysis, keyword extraction, and text categorization on review or survey data
Schedule Playbooks to rerun analysis daily, weekly, or monthly and deliver reports by email
Export generated Python, SQL, and R code so you can audit or reuse the logic elsewhere
Convert PDFs and bank statements into structured spreadsheet tables inside the same chat
kasipa (formerly deepsheet) Top Features
Upload CSV, Excel (.xlsx/.xls), or paste a Google Sheets link to start charting
Ask questions in plain English and get Plotly charts you can refine with follow-ups
Spreadsheet parsing and chart generation run locally in the browser via WebAssembly
No sign-up required to upload data and build your first visualization
Multi-sheet Excel workbooks let you pick which tab to visualize
Community showcase for browsing and sharing public data visualizations
Bar, line, pie, scatter, histogram, heatmap, and box plot chart types supported
Formula Bot (formerly Excel Formula Bot) Category
- Excel
kasipa (formerly deepsheet) Category
- Excel
Formula Bot (formerly Excel Formula Bot) Pricing Type
- Freemium
kasipa (formerly deepsheet) Pricing Type
- Freemium