Jspreadsheet vs kasipa (formerly deepsheet)
Dive into the comparison of Jspreadsheet vs kasipa (formerly deepsheet) and discover which AI Excel tool stands out. We examine alternatives, upvotes, features, reviews, pricing, and beyond.
When comparing Jspreadsheet and kasipa (formerly deepsheet), which one rises above the other?
When we compare Jspreadsheet and kasipa (formerly deepsheet), two exceptional excel tools powered by artificial intelligence, and place them side by side, several key similarities and differences come to light. The upvote count is neck and neck for both Jspreadsheet and kasipa (formerly deepsheet). Since other aitools.fyi users could decide the winner, the ball is in your court now to cast your vote and help us determine the winner.
Think we got it wrong? Cast your vote and show us who's boss!
Jspreadsheet
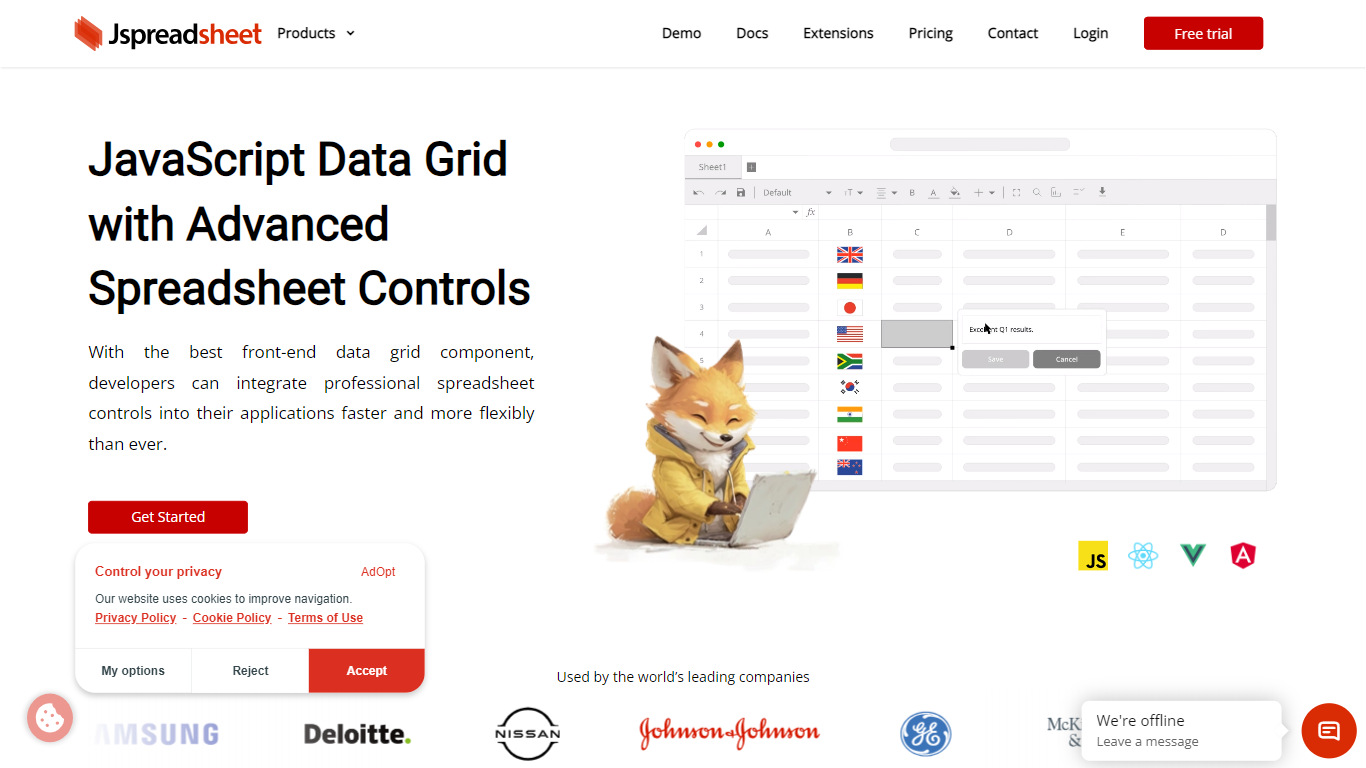

What is Jspreadsheet?
Jspreadsheet is a JavaScript spreadsheet component you drop into web apps when users expect Excel behavior, not just a sortable table. It ships as a front-end library for vanilla JavaScript, React, Vue, or Angular, with 500+ Excel-compatible formulas, import and export for 16+ file formats, and optional AI functions wired into cells. Because the code runs in your application, data stays on your infrastructure under your security model.
Most data grid libraries optimize for read-heavy tables with filtering and pagination. Jspreadsheet targets the opposite workload: modeling, bulk edits, and reporting where the fill handle, absolute references, and paste-from-Excel round-trips are what users test in the first minute. Google Sheets and Excel bake AI into their clouds; Jspreadsheet ships code so you choose the model endpoint, including a local one with no outbound traffic.
It fits teams building SaaS products, internal tools, financial dashboards, and data entry screens that still revolve around spreadsheets. Customer logos on the site include Samsung, Deloitte, and Johnson & Johnson. Jspreadsheet Server adds an optional Node.js backend for live multi-user editing, version history, and document persistence when a browser-only component is not enough.
kasipa (formerly deepsheet)
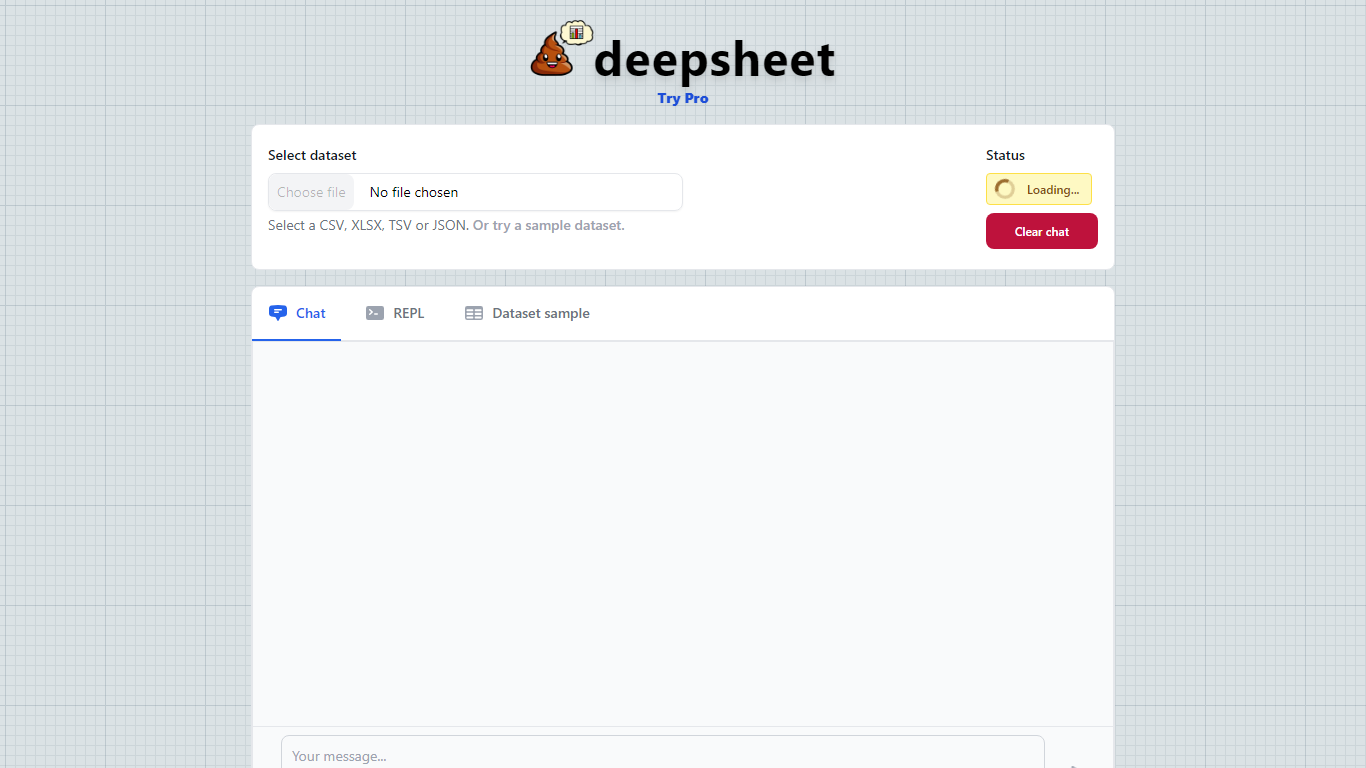
What is kasipa (formerly deepsheet)?
kasipa (formerly deepsheet) turns CSV, Excel, or Google Sheets into interactive Plotly charts when you ask questions in plain English. Upload a spreadsheet or paste a Google Sheets link, describe the chart you want, and refine the result with follow-up messages until it matches what you need.
Unlike cloud analytics suites that upload your files to remote servers, kasipa runs spreadsheet parsing and chart generation locally in the browser via WebAssembly. That local-first approach suits quick one-off visualizations where you do not want data leaving your device, though team database connections and shared Explores sit behind the paid Professional tier.
You can start charting without creating an account, and multi-sheet Excel workbooks let you pick which tab to visualize. kasipa also hosts a community showcase where users publish charts built from public-interest datasets, plus dedicated CSV and Excel to chart landing pages for fast uploads.
Creator Dylan Castillo built kasipa for analysts, researchers, and business users who want spreadsheet insights without writing code or juggling separate charting tools.
Jspreadsheet Upvotes
kasipa (formerly deepsheet) Upvotes
Jspreadsheet Top Features
500+ Excel-compatible formulas with a dependency-graph calculation engine
Import and export 16+ formats including .xlsx, .csv, and .ods with formatting preserved
React, Vue, Angular, and vanilla JavaScript packages with TypeScript definitions
Enterprise from $249 per month; Ultimate adds ChatGPT, Server, and PDF export extensions
30-day production trial with no credit card; free for development use
Virtualized rendering that stays responsive on hundred-thousand-row pastes
kasipa (formerly deepsheet) Top Features
Upload CSV, Excel (.xlsx/.xls), or paste a Google Sheets link to start charting
Ask questions in plain English and get Plotly charts you can refine with follow-ups
Spreadsheet parsing and chart generation run locally in the browser via WebAssembly
No sign-up required to upload data and build your first visualization
Multi-sheet Excel workbooks let you pick which tab to visualize
Community showcase for browsing and sharing public data visualizations
Bar, line, pie, scatter, histogram, heatmap, and box plot chart types supported
Jspreadsheet Category
- Excel
kasipa (formerly deepsheet) Category
- Excel
Jspreadsheet Pricing Type
- Paid
kasipa (formerly deepsheet) Pricing Type
- Freemium