
Last updated 08-09-2026
Category:
Reviews:
Join thousands of AI enthusiasts in the World of AI!
QuantPlus
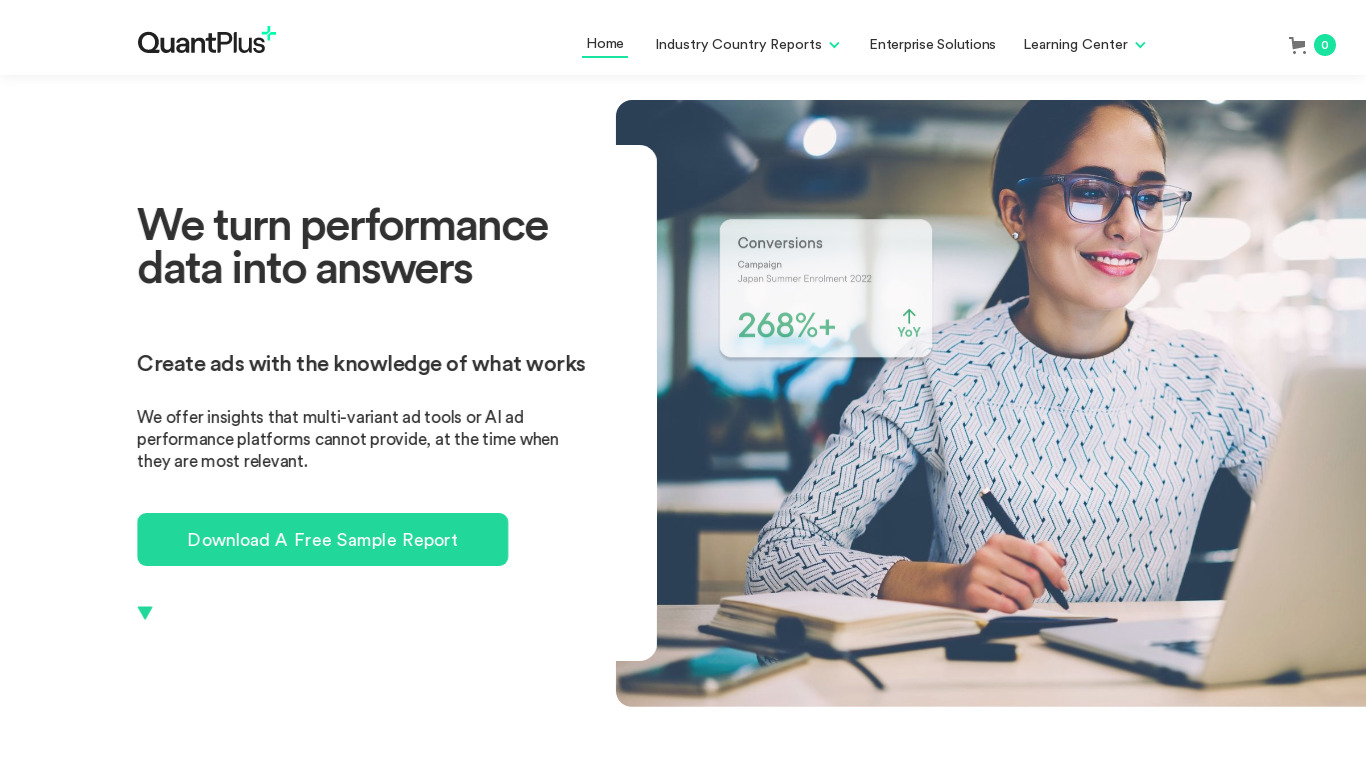
QuantPlus turns competitor display ads into ranked marketing intelligence before you launch a campaign. The platform collates creatives from Facebook, Google Display, Instagram, and Twitter, then breaks each ad into text and image elements so you see which calls to action, colors, phrases, and layouts actually drove engagement in your sector and country.
Most ad optimization tools wait for live spend to learn what works. QuantPlus flips that sequence: pre-launch reports rank proven elements from massive historical sets so creative teams start from market winners instead of guessing. Published case work shows conversion moving from 2.8% to 12.6% after applying insights, and the site cites client ROAS between 6X and 10X. Enterprise Solutions adds custom reporting on your own creative library when off-the-shelf industry packs are not enough.
Media buyers, in-house marketers, and agency designers use QuantPlus Creative Insights at the briefing stage to cut wasted variants and align copy with what already performed. Reports renew annually as market creative shifts, and sample industry-country reports are available before you buy a full sector pack.
Collates ad creatives from Facebook, Google Display, Instagram, and Twitter
Deconstructs each ad into ranked elements like CTAs, colors, copy phrases, and imagery
Industry-country Creative Insights reports priced per vertical sector
Published case example lifts conversion from 2.8% to 12.6% after applying insights
Site cites client ROAS between 6X and 10X from insight-informed ads
Enterprise Solutions unlock custom reporting on your own creative data sets
Physical offices in Sydney, New York, and Montreal for discovery calls
Pre-launch rankings replace months of in-market testing for many creative decisions.
Element-level breakdown covers CTAs, colors, copy phrases, imagery, and layout.
Covers major display and social platforms in one intelligence workflow.
Free sample industry-country reports let teams evaluate before buying.
Enterprise tier analyzes your own creative library when sector packs are not enough.
Creative Insights pricing is per industry with no public dollar amounts listed.
Reports focus on display and social ads, not TV or offline channels.
Enterprise value depends on having enough owned creative data to analyze.
Site content has not been updated since early 2024 in the Webflow publish stamp.
What does QuantPlus do?
QuantPlus analyzes competitor display ads and ranks which creative elements performed best in a given industry and country. QuantPlus Creative Insights reports cover calls to action, colors, copy phrases, imagery, and layout so marketers design from data before launch.
Which ad platforms does QuantPlus cover?
QuantPlus collates creatives from Facebook, Google Display, Instagram, and Twitter. QuantPlus compares each deconstructed element against engagement, impressions, conversions, and spend data from those major platforms.
How is QuantPlus different from A/B testing?
QuantPlus focuses on pre-launch optimization using historical competitor performance instead of waiting for in-market tests. QuantPlus ranks proven elements upfront so teams avoid launching many low-performing variants to learn what works.
What ROI has QuantPlus reported?
QuantPlus publishes a case where conversion rose from 2.8% to 12.6% after applying insights, labeled as 300% ROI. QuantPlus also states clients have demonstrated between 6X and 10X ROAS on ads informed by its creative intelligence.
How does QuantPlus pricing work?
QuantPlus Creative Insights are priced per industry sector with a buy flow on quantplus.io. QuantPlus Enterprise Solutions adds custom reporting on client-owned creative libraries and requires booking a discovery call.
Can I preview a QuantPlus report?
Yes. QuantPlus offers free sample industry-country reports and sample requests through its website forms. QuantPlus also hosts demonstration calls via its Book a Call page before you purchase a sector report.