
Last updated 10-23-2025
Category:
Reviews:
Join thousands of AI enthusiasts in the World of AI!
Bar Graph Generator
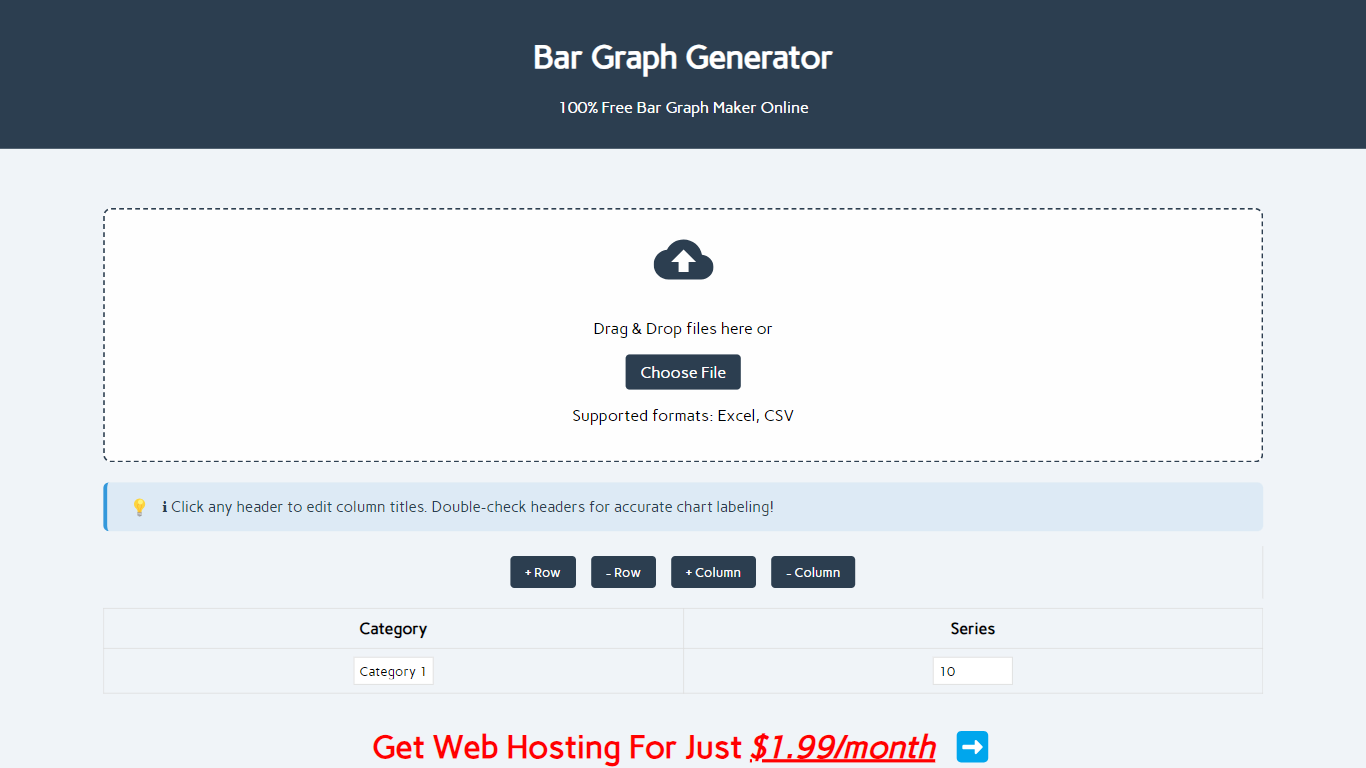
The Bar Graph Generator is a free online tool designed to create custom bar charts quickly and easily. It allows users to visualize data without the need for complex software like Excel. The core functionality of this tool is to enable users to input their data and generate professional-looking bar graphs in just a few simple steps. This makes it an ideal solution for anyone needing to present data visually, whether for academic, business, or research purposes.
The target audience for the Bar Graph Generator includes students, educators, professionals, and researchers. These users often require a straightforward way to create bar charts for various applications, such as classroom presentations, business reports, or scientific publications. The tool's user-friendly interface ensures that even those with minimal technical skills can produce high-quality visualizations without any hassle.
One of the unique value propositions of the Bar Graph Generator is its simplicity and accessibility. Unlike traditional spreadsheet programs that require extensive formatting and technical know-how, this online tool streamlines the process of creating bar charts. Users can generate charts instantly, making it a time-saving option for those who need to visualize data quickly.
Key differentiators of the Bar Graph Generator include its automatic formatting and scaling features, which ensure that the generated visuals are publication-ready. Additionally, the tool supports various data formats, such as Excel and CSV, allowing users to easily import their data. The ability to edit charts after downloading further enhances its usability, as users can make adjustments without starting from scratch.
From a technical standpoint, the Bar Graph Generator utilizes Chart.js, a trusted data visualization library, to ensure mathematical accuracy in the generated charts. This commitment to precision, combined with its ease of use, makes the Bar Graph Generator a reliable choice for anyone looking to create bar charts online.
User-friendly interface that allows anyone to create bar charts without technical skills.
Supports multiple data formats like Excel and CSV for easy data import.
Automatic formatting and scaling ensure that charts are ready for publication.
Ability to edit charts after downloading, making it easy to make changes.
Switch between vertical and horizontal bar graphs with just one click.
How accurate are the generated bar charts?
The generated bar charts are mathematically accurate, as the tool uses precise calculations to plot values proportionally.
Can I edit my chart after downloading?
Yes, you can reopen your data file in the bar chart creator to make changes without starting from scratch.
What's the difference between vertical and horizontal bar graphs?
Vertical charts are best for time-based data, while horizontal charts work better for long category names. You can switch between both easily.
Do I need to sign up to use the Bar Graph Generator?
No, you can use the Bar Graph Generator without any sign-up or installation required.
What types of users benefit from this tool?
Students, educators, professionals, and researchers can all benefit from the Bar Graph Generator for their data visualization needs.
Is the Bar Graph Generator free to use?
Yes, the Bar Graph Generator is completely free to use.
What is a bar graph?
A bar graph is a visual tool that uses rectangular bars to compare different categories of data, making it easy to see comparisons.