
Last updated 06-30-2026
Category:
Reviews:
Join thousands of AI enthusiasts in the World of AI!
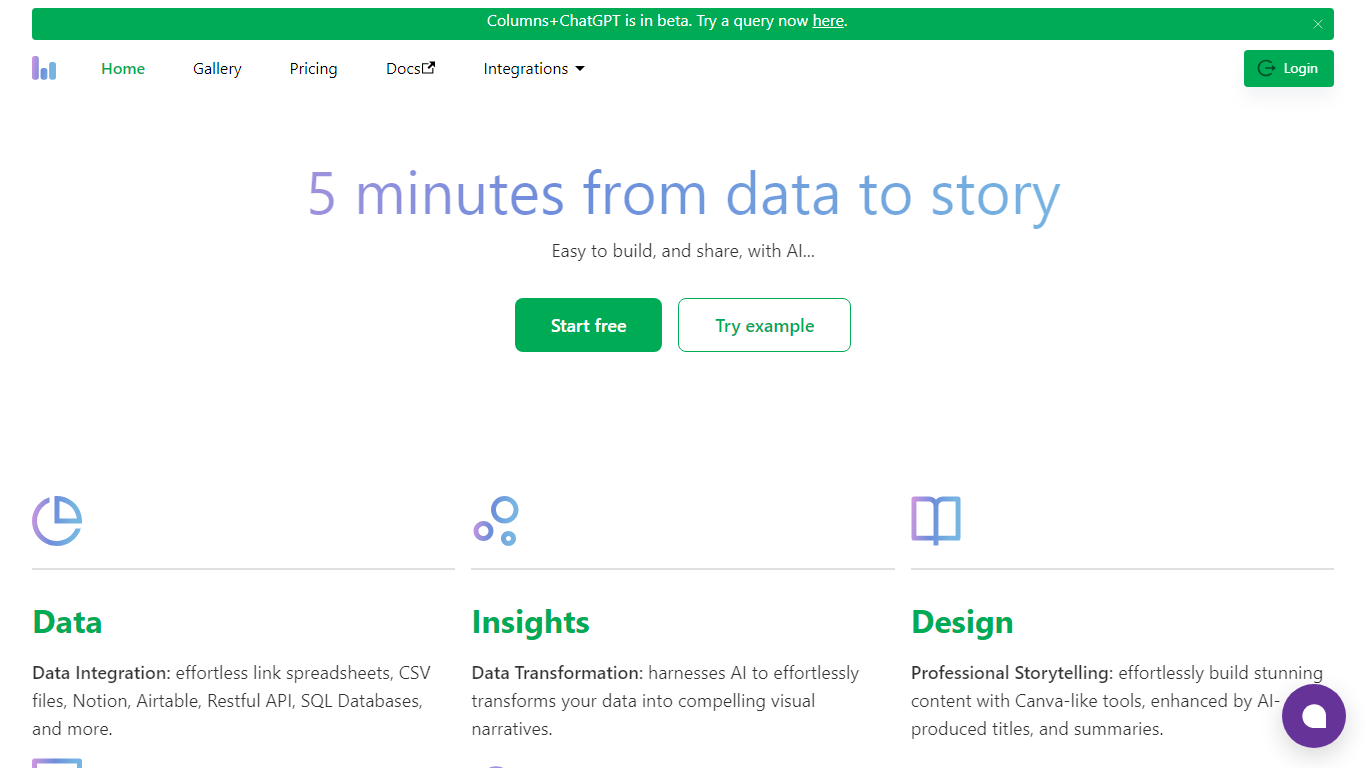
Columns AI (formerly Columns)
Columns AI is an end-to-end data platform that connects messy files and live sources, automates transformations, and turns the results into charts and dashboards you can share. It is built around three products: Drive for ingesting and structuring files, Flow for no-code data pipelines, and Graph for branded visualizations.
The platform targets teams that need reliable data workflows without standing up a full engineering stack. You can connect Google Sheets, Airtable, Notion, Excel, databases, Snowflake, HubSpot, QuickBooks, Gusto, and HTTP APIs, then describe transformations in plain language instead of writing SQL.
Columns AI fits business operators, consultants, marketing and RevOps teams, analysts, and freelancers who need to move from raw inputs to client-ready visuals. Founder Shawn Cao previously built large-scale data infrastructure at Microsoft, Facebook, and Pinterest.
Columns Drive turns CSV, Excel, PDF, and image uploads into structured, analysis-ready data with OCR and auto-cleaning
Columns Flow connects warehouses, APIs, and files, then builds transformation logic from plain-language prompts
Columns Graph creates brand-matched charts you can share via live links, embeds, PNG, SVG, CSV, or slide decks
Scheduled sync keeps downstream graphs and reports updated without manual exports
Alert rules notify you via Slack, email, or webhook when thresholds, spikes, or drops occur
Integrations include Google Sheets, Airtable, Notion, Postgres, Snowflake, HubSpot, QuickBooks, and Gusto
Three-product stack covers ingestion, automation, and visualization without switching tools
Plain-language flow building reduces the need for SQL or custom scripts
Usage-based Basic tier has no monthly base fee
Wide connector list spans spreadsheets, databases, CRM, and accounting tools
Branded embeds and export formats support client-facing reporting
Costs scale with row volume, which can add up for very large datasets
Enterprise controls require contacting sales for custom pricing
What are Columns Drive, Flow, and Graph?
Drive ingests and structures files like CSV, Excel, PDF, and images. Flow automates data pipelines from connected sources with plain-language transformations. Graph turns structured data into branded charts, embeds, and exportable visuals.
How does Columns AI pricing work?
Basic is free with no monthly fee and charges $0.05 per 1,000 rows processed across Drive, Flow, and Graph. Premium is $20 per month at $0.03 per 1,000 rows, and Platinum is $50 per month at $0.01 per 1,000 rows. New signups can start with a $10 credit.
Does the free Basic plan expire?
No. Basic stays free with no time limit. You only pay for rows you actually process at the per-row rate listed on the pricing page.
What data sources does Columns AI support?
Columns AI connects to Google Sheets, Airtable, Notion, Excel, HTTP APIs, Postgres, Snowflake, HubSpot, QuickBooks, Gusto, and file uploads through Drive.
Can I automate recurring data updates?
Yes. Flow supports scheduled runs such as hourly, daily, or weekly so downstream graphs and reports stay in sync without manual refreshes.
How can I share charts and dashboards?
Graph lets you share live links, iframe embeds, PNG, SVG, CSV exports, and presentation decks. Sharing options include domain whitelisting and password-protected embeds.
Is there a Gmail add-on for Columns Drive?
Yes. Columns Drive is listed in the Google Workspace Marketplace so you can install it in Gmail and turn email attachments into structured spreadsheet data.